little ice-jam threat), an ice sheet will be present up-
Table 1. Froude scaling expres-
stream of the prototype ICS at breakup. Nevertheless,
sions between model (m) and
we conducted a few tests with no ice cover in the main
prototype (p).
channel upstream of the ICS because they represent a
simpler case for validating a numerical model of break-
Parameter
Scaling expression
up jamming at an ICS (Hopkins et al. 1996).
length
Lp/Lm = 15
Vp/Vm = 151/2
velocity
Tp/Tm = 151/2
time
Model results
Qp/Qm = 155/2
discharge
Table 2 summarizes the test conditions and results
Fp/Fm = 153
force
of the physical model study. We observed three main
Mp/Mm = 154
moment
outcomes for tests with ice covers initially upstream of
σp/σm = 15
ice strength
the ICS: 1) no release prior to the maximum pumping
capacity, 2) slow washout of ice floes through a gap, and
them to remove the deadweight of the piers. Although
3) rapid release of most of the jam through more than one
they were fewer than the number of piers, we distributed
gap. For discharges below 6000 cfs (the design discharge),
these load cells to obtain representative results. We also
there were no releases through the cylindrical-pier ICS,
manually measured ice thickness, flexural strength, and
regardless of gap width. Releases took place above the
piece-size distribution, and video cameras recorded the
design discharge on only three occasions (tests 18, 20,
tests. We used Froude scaling to relate model and pro-
and 23), but in the only test where ice released over the
totype values (Table 1).
cylindrical piers (test 18), the ice was relatively thin
Most tests were conducted to simulate ice breakup
(0.89 ft) and the discharge had reached 9100 cfs. Wash-
along Cazenovia Creek. Ice covers about 12 ft thick
outs were more common and occurred for all three gaps
were grown on the river channel and in the ice-supply
tested, and it is difficult to discern a quantitative differ-
flume. We would manually break the latter ice cover
ence in performance. Qualitatively, however, the 14-ft-
and feed it into the head of the model behind a porous
gap cylindrical-pier ICS tended to produce brief wash-
gate. We would also partially break the ice cover in the
outs at lower discharges and longer-duration washouts
river channel, usually leaving about 160 ft intact imme-
near maximum discharge, especially for thinner or
diately upstream of the ICS. After establishing a base
weaker ice. We saw no qualitative or quantitative dif-
flow of 10001500 cfs, we would release the gate to
ference between the performance of the cylindrical-pier
simulate arrival of an ice run at the ICS reach. This ice
ICS for the two smaller gaps.
run would form an ice jam, which would then collapse
Comparable tests of the sloped-block and cylindrical-
in stages onto the ICS as we increased discharge. The
pier ICS's at the same pier gap (14 ft) illustrate the in-
tests continued until the ice jam released or we reached
creased ice-retention capability of the latter structure.
maximum discharge (less than 8000 cfs) after about
For moderate ice thickness (1.01.1 ft) and strength (70
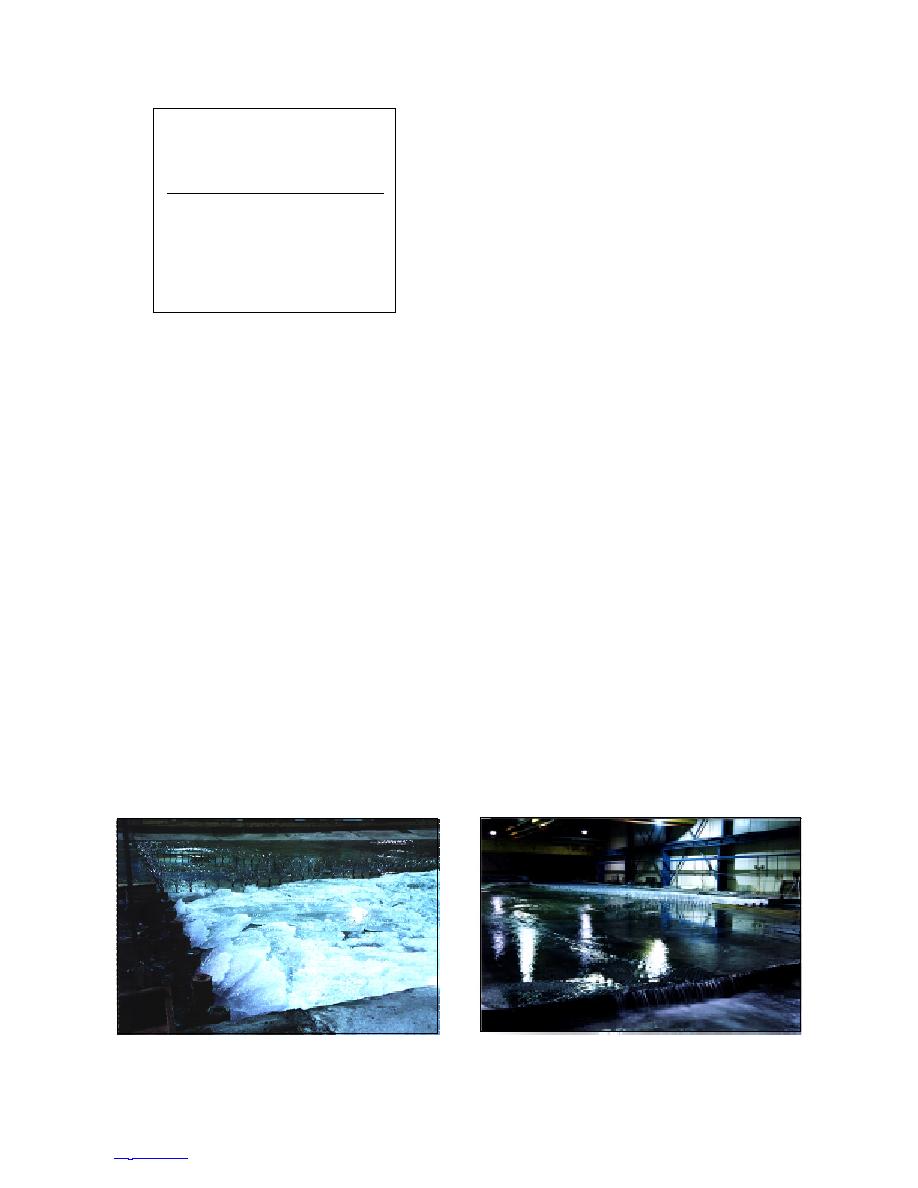
1012 hours (prototype). Figure 8 shows a typical ice
100 psi), the ice jams washed out between or released
jam formed by the cylindrical-pier ICS and the result-
over the sloped-blocks at discharges below the design
ing floodplain flow.
value (tests 13 and 14) but were held well beyond the
Unless ice conditions are very mild (and thus pose
design discharge by the cylindrical piers (tests 4 and 6).
b. Looking upstream across floodplain.
a. Looking across ICS towards model trees on floodplain.
Figure 8. Typical ice jam formed in model.
6
TO CONTENTS


 Previous Page
