1.00
0.80
0.60
0.40
0.20
0.00
0.0
0.2
0.4
0.6
0.8
1.0
Downstream Moment, M
(M ft-lb)
y
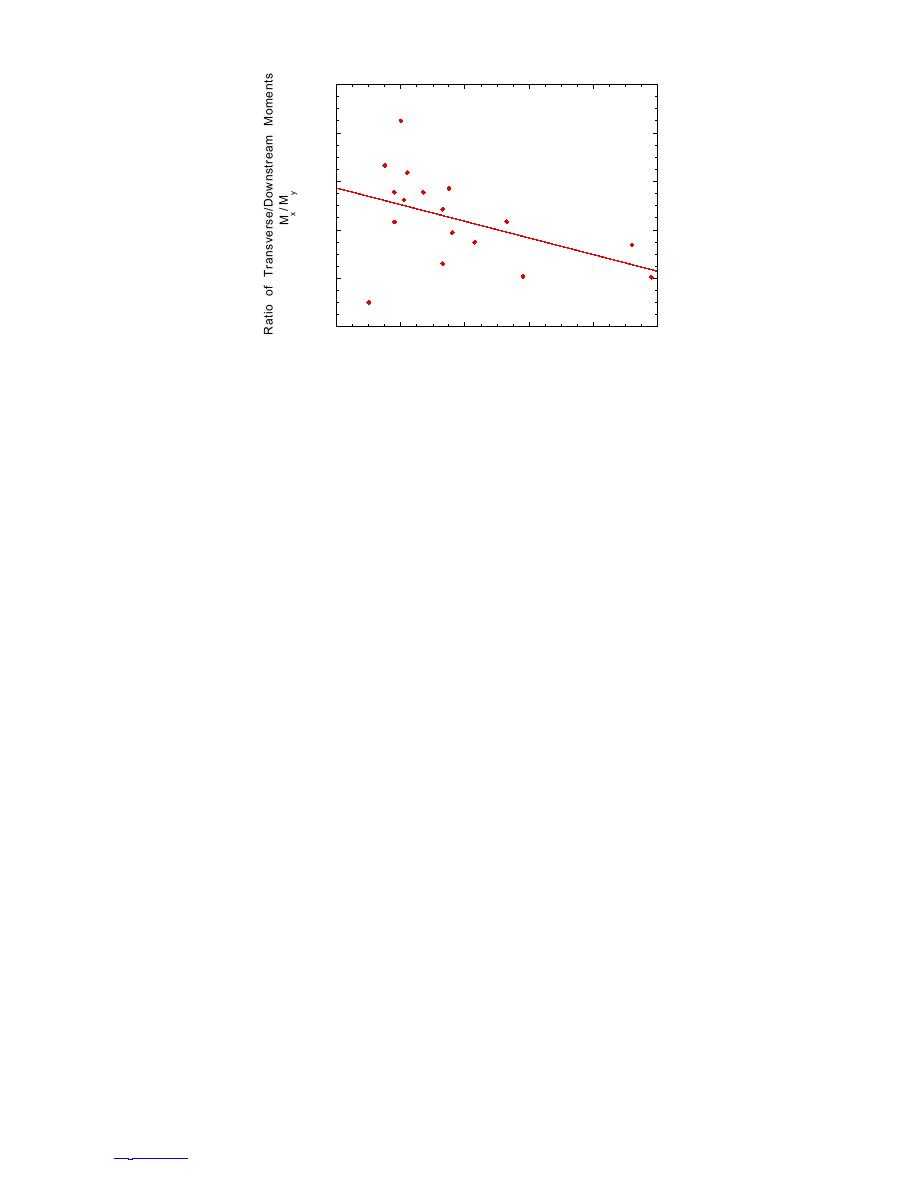
Figure 14. Ratio of transverse-to-downstream moments versus
downstream moment, My, at the time of peak transverse moment,
Mx, during each test.
cylindrical-pier ICS arrested the initial runs but released
design downstream force acts halfway up the pier, and
the resulting ice jams at about 50% of the design dis-
the design transverse moment is half of the design down-
charge. However, this scenario should not occur at the
stream moment.
prototype ICS. The piers will form a small pool that
These design loads may occur simultaneously on a
will preferentially freeze early and solidly. With this
pier because they often derive from the same event.
ice upstream, the ICS will arrest an ice run and hold a
For this reason, although we did not record transverse
jam well beyond the design discharge. Any later ice
forces, Fy, we may estimate the design value as
Fy = Mx/Lp = 0.20 106 lb. This assumes that trans-
runs will impact and add to the jam rather than inter-
acting directly with the piers.
verse and downstream moments act at the same height
on the pier (4.4 ft above the bed) for the design event.
Design ice loads
We may compare these results with the downstream
The model data can provide design ice loads for
loads used to design the original weir-with-piers ICS.
downstream and transverse overturning moments and
Recall that its function was different. During breakup,
forces. The peak downstream moments measured during
floes arriving from upstream would collect in the pool
each test were cast in a statistical framework for the
upstream of the ICS, causing the overlying ice sheet to
purpose of determining these design loads. We recom-
ride up the piers, essentially to their tops. The design
mend designing for loads at a cumulative-probability
value of the downstream ice load was assumed to result
level of 99.9% and describe design loads here based on
from the crushing failure of a 1-ft-thick sheet across
that probability. This corresponds to an average return
the 3-ft width of the pier at a pressure of 262 psi, result-
ing in Fx = 0.11 106 lb (U.S. Army 1986b). Although
interval of 1000 years, assuming one ice-breakup event
per year. Design loads based on higher or lower proba-
this is lower than Fx determined here, it acted much
bilities can be determined using the same procedure.
higher on the pier so that the design overturning moment
The results on Figure 11 directly yield Md = 2.0 106
was similar, Md = 1.5 106 ft-lb. Rather than experi-
ft-lb as the design value for downstream overturning
encing ice-crushing failure, however, the piers in the
moment. We may use this value to estimate the other
present ICS are subjected to direct ice-floe impacts and
design loads. Because Lp tends to increase slightly for
unsteady ice-jam formation and collapse events.
increasing My, we may obtain a conservative estimate
It is also interesting to compare the recommended
of design value of the downstream force, Fx = Md/Lp,
design loads with those resulting from application of
by using the average value of Lp = 4.4 ft. This yields
the AASHTO (1998) design standards for bridge piers.
Fx = 0.45 106 lb as the design value for downstream
These standards rely heavily on the work of Montgom-
force. Similarly, because Mx/My tends to decrease
ery et al. (1984), which also formed the basis for design
for increasing My, we may obtain a conservative esti-
standards in Canada (CSA 1988).
mate of design value of the transverse moment,
The AASHTO standards differentiate among crush-
Mx = (Mx/My) Md, by using the average value of Mx/My
ing (across the full width of a pier), bending, and im-
= 0.45. This yields Mx = 0.90 106 ft-lb as the design
pact ice-failure modes. They note that impact failure,
value for transverse moment. Roughly speaking, the
where a small floe comes to rest before it has crushed
10
TO CONTENTS


 Previous Page
