2.0
1.5
1.0
0.5
0.0
.01
.1
1
5 1 0 2 03 0
50
7 08 0 9 0 9 5
99
99.9 99.99
Percent
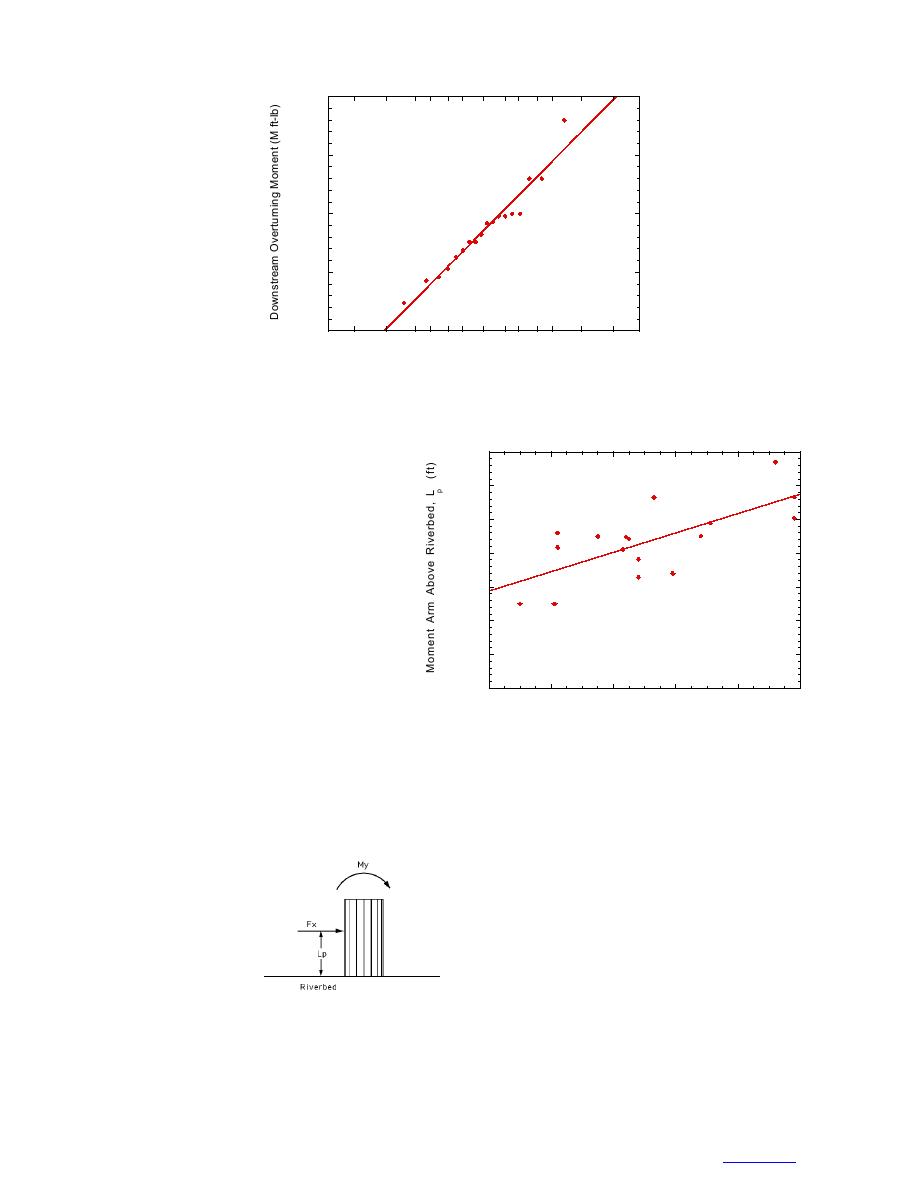
Figure 11. Cumulative probability for measured peak down-
stream overturning moments, Md. The straight line represents
the best-fit normal distribution to the data.
7.0
tively be long in duration. Thus, we selected
the largest downstream moment, impact or sus-
6.0
tained, measured on any of the five instrument-
ed piers as the peak downstream moment for each
5.0
test, Md.
Table 2 shows the resulting values of Md.
4.0
Interestingly, these peak moments are not cor-
related with ice thickness, ice strength, or pier
3.0
gap (Fig. 10). We also saw no dependence on
pier location. This allows us to treat the Md
2.0
values as a single population and thereby
develop a statistical basis for design loads. Fig-
1.0
ure 11 shows the resulting probability distribu-
0.0
0.0
0.2
0.4
0.6
0.8
1.0
scale. A straight line fits the data reasonably
Downstream Overturning Moment, M (M ft-lb)
well, implying a normal distribution.
y
We also compiled for each test the peak Figure 13. Effective moment arm, L , versus downstream
p
downstream force, Fx, peak transverse over- moment, My, at the time of the peak downstream force, Fx,
turning moment, Mx, and the downstream over- during each test.
turning moments at the times of those peaks,
My, all measured by the six-axis load cell. As with Md,
able assumption for cylindrical piers during breakup.
Figure 13 shows that Lp tends to increase slightly for
strength, or pier gap.
increasing My, indicating that rising ice-contact height
From the ratio My/Fx,
and increasing downstream force both contribute to
we may compute the
large downstream overturning moments. Similarly, Fig-
effective moment arm,
ure 14 shows that the ratio Mx/My tends to decrease for
Lp, relating the mea-
increasing My, although the correlation is not strong.
sured downstream
In only one case (test 3) did the ICS not arrest the
force to the down-
initial breakup ice run. This test began with no ice in
stream overturning
the main channel upstream of the ICS. The test out-
moment (Fig. 12).
come agrees with observations at the Hardwick sloped-
Figure 12. Effective moment
This calculation as-
block ICS: after release of an initial jam, a subsequent
arm, Lp, relating downstream
sumes that vertical ice ice force, F , to downstream
ice run consisting of 1-ft-thick floes (or less) will not
x
forces contribute neg- overturning moment, My,
jam across the 14-ft gaps at the ICS. We repeated this
ligibly to My, a reason- measured on six-axis load cell.
test with thicker ice (tests 9 and 10) and found that the
9
TO CONTENTS


 Previous Page
