14
These test results showed that, as expected, the cylin-
drical-pier ICS will retain an ice jam at discharges much
~9500 cfs
12
higher than that needed to release a natural ice jam.
Consequently, upstream water levels will increase com-
Flood Stage
pared to existing conditions. We used a numerical ice
10
hydraulic model to determine the maximum water sur-
~6700 cfs
face elevations upstream of the structure and the loca-
8
tion beyond which the ICS should cause no effect.
CELRB then used these results to establish real estate
6
requirements for project construction.
This report describes the model tests of the new
Cazenovia Creek ICS, the design recommendations
4
2
3
29
1
based on those tests, and the ICS's expected upstream
February 1972
March 1972
effects. Where possible, we compare results with the
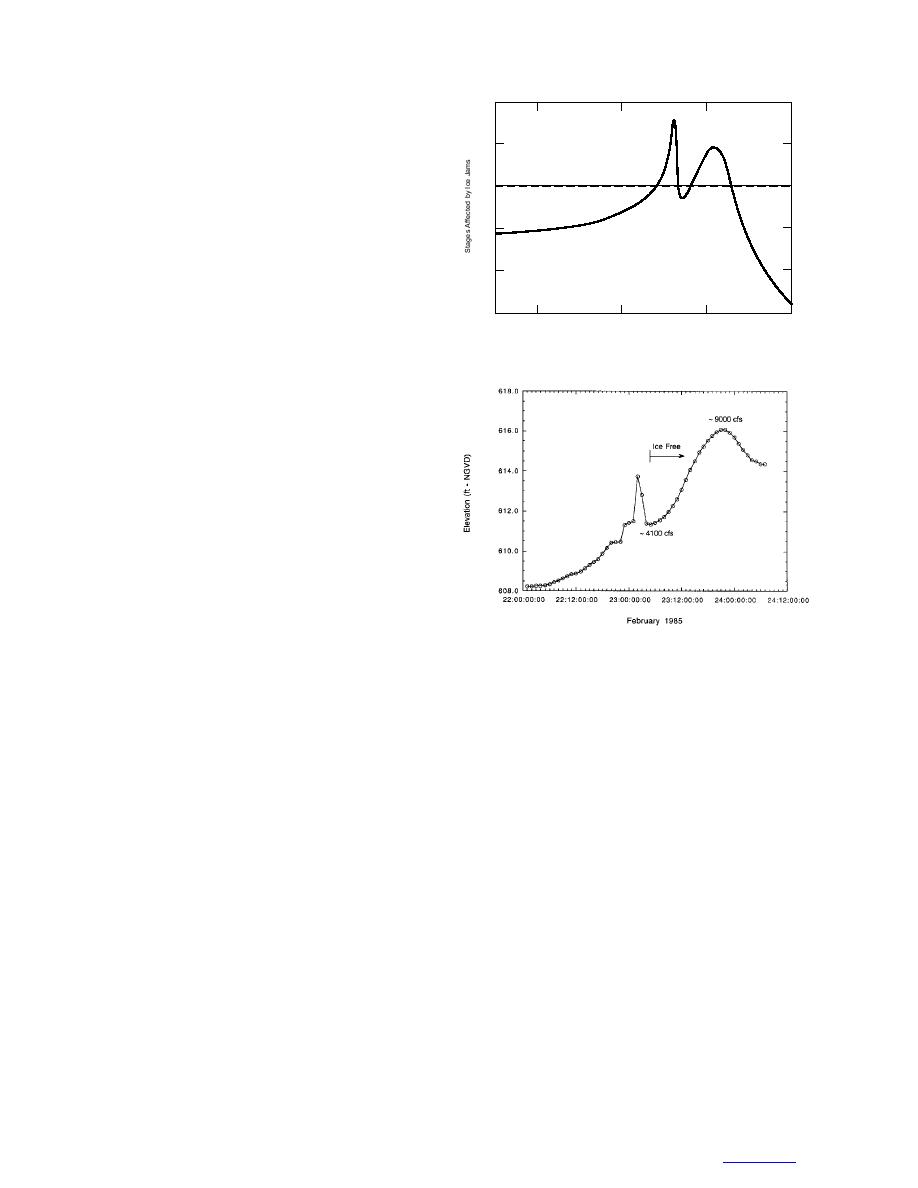
a. 2 March 1972. (After U.S. Army 1972.)
original weir-with-piers ICS. Note that all physical units
reported here are prototype scale, including those
derived from model tests. All elevations quoted are
National Geodetic Vertical Datum (NGVD).
Icehydraulic conditions
Figure 1 shows a map of the Cazenovia Creek water-
shed in western New York. The drainage area is 144
mi2. The main stem of the Cazenovia Creek is about 17
miles long from the confluence of the creek's east and
west branches in East Aurora to the Buffalo River. Its
average slope along this section is 0.0026 or about 14
ft/mile.
As mentioned earlier, snowmelt and rainfall events
in mid-winter and early spring have caused numerous
ice-jam floods along Cazenovia Creek in West Seneca
b. 23 February 1985
and Buffalo. The main stem contributes most of the ice
Figure 4. Hydrographs from USGS Ebenezer gage
volume to these jams. Increasing discharge fractures
for two ice-jam events.
the ice cover, lifts it free of the banks, and sends it down-
stream as a surge of water and ice floes. Shear walls
(i.e., walls of packed ice) have been observed from Tran-
the 1972 and 1985 events, the discharges correspond-
sit Road to Mill Road, indicating at least temporary
ing to the broad, open-water peaks were about 9500
formation of ice jams. However, the damage-causing
and 9000 cfs, respectively. The maximum discharge of
ice jams form when the ice run encounters the strong,
record (since 1941) was 13,500 cfs on 1 March 1955.
thick ice sheet along the flatter reach below Mill Road.
The maximum discharge occurring during a known ice-
These jams may release after several hours and reform
jam event was 12,600 cfs on 22 January 1959. Ice thick-
downstream until discharge is sufficient to clear ice into
ness prior to breakup ranges widely, but few flooding
the Buffalo River and thence to Lake Erie.
problems have occurred for ice thinner than about 10
in.
USGS Ebenezer gage at Ridge Road. Figure 4 shows
The site selected for both ICS concepts lies about
stage hydrographs from the gage for ice jam floods
2300 ft upstream of Mill Road (Fig. 5). The creek at
this location drains 129 mi2, its main channel is about
occurring on 2 March 1972 and 23 February 1985. The
hydrographs show characteristics typical of ice-jam
150 ft wide and 7 ft deep, and the undeveloped, treed
events. The ice-affected stage increases slowly as the
floodplain is about 400 ft wide. The channel bed through
event begins. When an ice run passes the gage, the
the 2000-ft-long ICS reach consists of shale bedrock
measured stage rises sharply and falls abruptly. The gage
and has an average slope of 0.001; this slope increases
drops back to its open-water rating curve after the ice
to about 0.003 for the next 4 miles upstream. For 11
moves far downstream. The remainder of the hydro-
miles upstream of Mill Road, the creek flows through
graph, including the broad peak, is unaffected by ice
an incised valley that contains very little developed
and can provide accurate discharge measurements. For
property.
3
TO CONTENTS


 Previous Page
