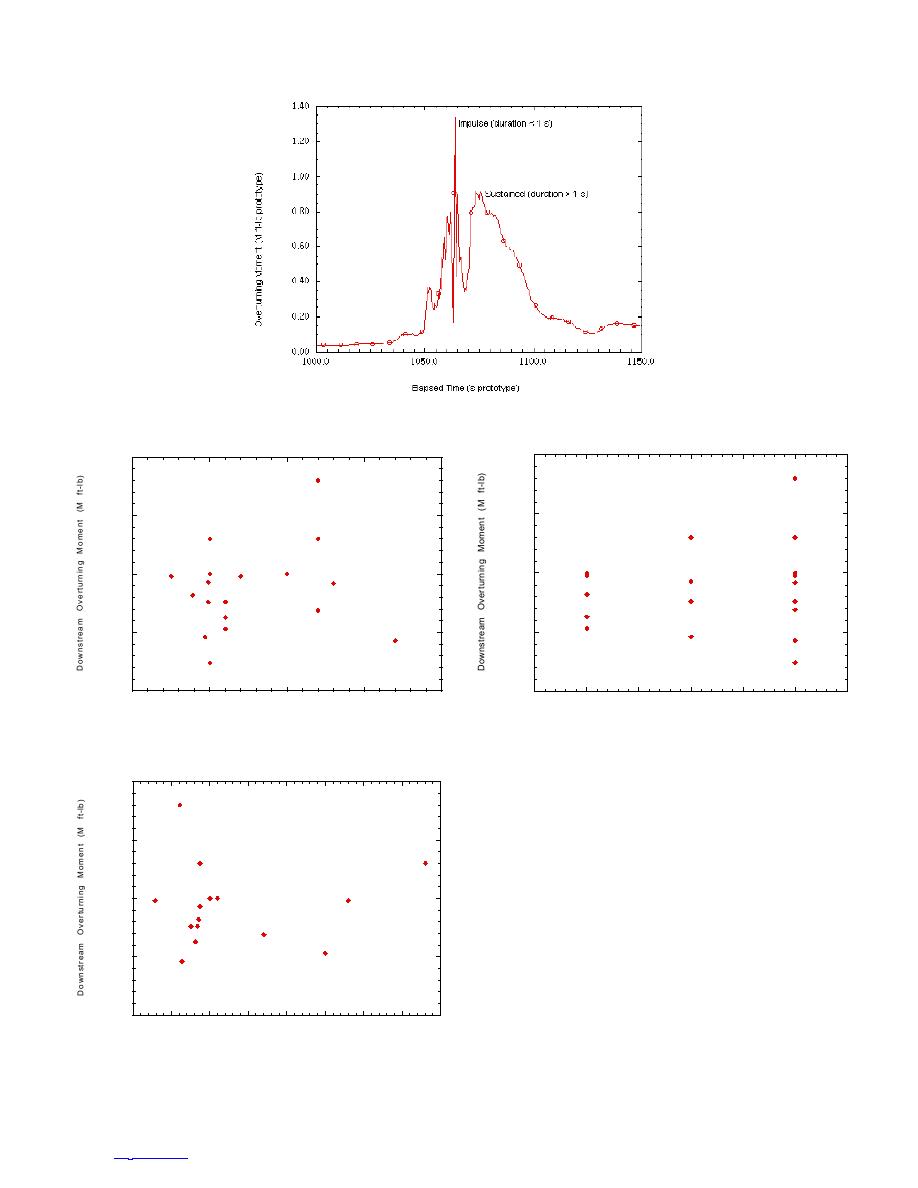
Figure 9. Measured downstream overturning moment (test 5,
M1), showing peak impulsive and sustained moments.
2.00
2.00
1.50
1.50
1.00
1.00
0.50
0.50
0.00
0.00
0.5
1.0
1.5
2.0
2.5
9
10
11
12
13
14
15
Ice Thickness (ft)
Pier Gap (ft)
c. Versus gap between piers.
a. Versus ice thickness.
Figure 10. Scatter plots of peak overturning moments. The
2.00
measured moments are essentially independent of these parame-
ters within the ranges tested.
Figure 9 shows a time series record of the downstream
1.50
overturning moment measured on a pier during ice-jam for-
mation. Peak impulsive moments (duration less than 1 sec-
ond) were usually caused by impacts of individual ice floes,
1.00
while peak sustained loads developed during unsteady ice-
jam formation and collapse events (which occurred on the
order of 10100 seconds). Montgomery et al. (1980) and
0.50
Montgomery and Lipsett (1980) provide convincing evidence
that even massive bridge piers can respond to impulsive loads
caused by ice impacts. The natural frequency of a pier (typ-
0.00
ically 120 Hz) governs its response to these dynamic loads
0
50
100
150
200
250
300
350
400
(Montgomery et al. 1980). Because the ICS piers will carry
Ice Flexural Strength (psi)
no superstructure, they should have frequencies at least as
b. Versus ice flexural strength.
high as bridge piers, and even ice-impact loads will effec-
8
TO CONTENTS


 Previous Page
