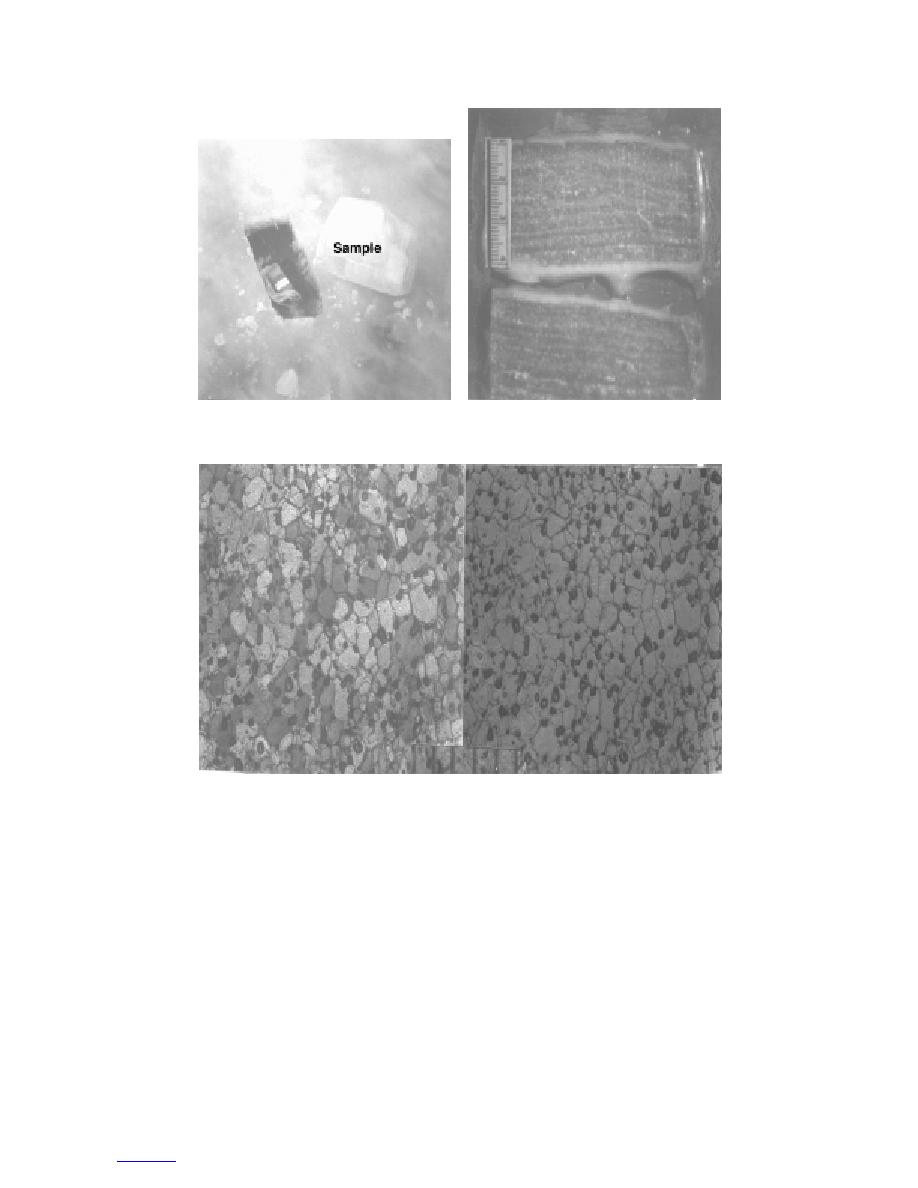
a. Sample location.
b. Vertical thick sections photo-
graphed in natural light.
c. Horizontal thin sections photographed in natural light (right) and be-
tween crossed polarizers (left).
Figure 17. Sample F1, taken from the main deck during the February icing
event (scales in millimeters). Note layering in thick sections. Dark circular
inclusions in thin sections are air bubbles.
when the thin section is rotated between crossed
crystal cross-sectional area, which is somewhat smaller
in sample F2 (0.45 mm2) than in F1 (0.60 mm2).
polarizers.
Sample F2. This sample (Fig. 18) was obtained
Sample F6. This sample (Fig. 19), measuring 1.8
from the deck at the location indicated in Figure 8, in
cm thick, was obtained from the DTMB ice accretion
proximity to the vertical bulkhead samples F3, F4, and
panel on the top of the hatch on the main deck. DTMB
F5. Though it is somewhat thinner (2.8 cm) than deck
had placed panels on the main deck hatch cover, and
sample F1 (3.2 cm), their physical properties are simi-
on the starboard side of the forward bulkhead, to
lar (see Tables 2 and 3), with the exception of mean
experiment with ice removal techniques. These panels
21
to contents


 Previous Page
