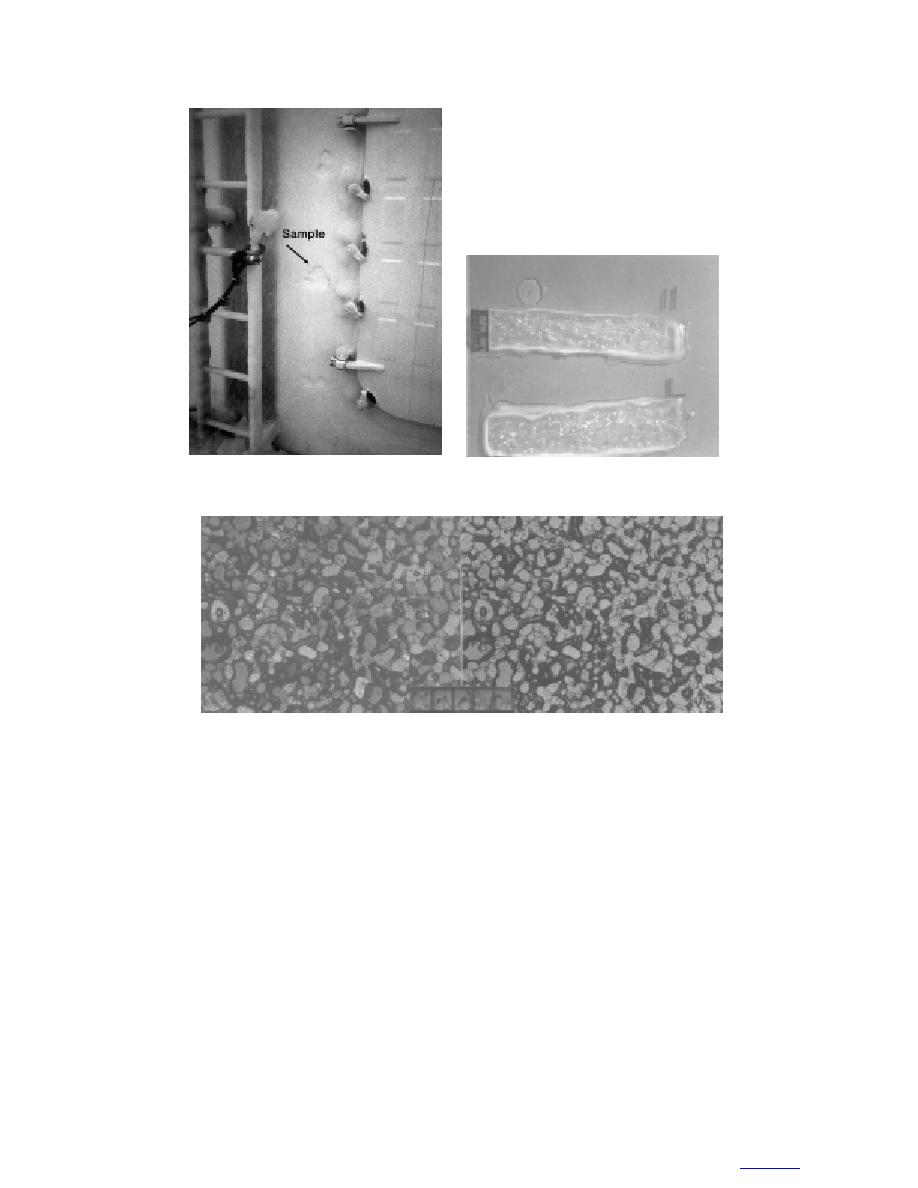
b. Thick sections photographed in
a. Sample location.
natural light.
c. Horizontal thin sections photographed in natural light (right) and be-
tween crossed polarizers (left). Note rounded shape of ice crystals.
Figure 12. Sample F4, taken from the forward bulkhead on the main deck
(scales in millimeters).
exhibits very weak layering in the vertical section, as
be significant differences in crystalline texture over
was also observed in sample F4 (Fig. 12). Density,
short distances of superstructure icing.
salinity, and brine inclusion characteristics were very
Sample F4. This is a bulkhead sample, 1.6 cm thick,
similar to those measured in sample F4. A mean bubble
diameter was also measured. However, crystals in
that was retrieved 1 m above the deck (Fig. 12). The
sample F3 are much larger than in sample F4, averag-
vertical thick section shows little evidence of layering.
ing 0.60 mm2 in cross-sectional area compared to 0.38
Grains in horizontal thin sections can be seen to pos-
mm2 in sample F4, even though sample F3 was ob-
sess generally rounded outlines. Multi-crystalline grains
tained from a lower level on the bulkhead than sample
occur abundantly in sample F4 and the mean crystal
cross section, 0.38 mm2, was the smallest measured in
F4. The reason for this difference in crystal size is not
known. This result serves to demonstrate that there can
the February icing series. Salinity was 14.1‰. Derived
16
to contents


 Previous Page
