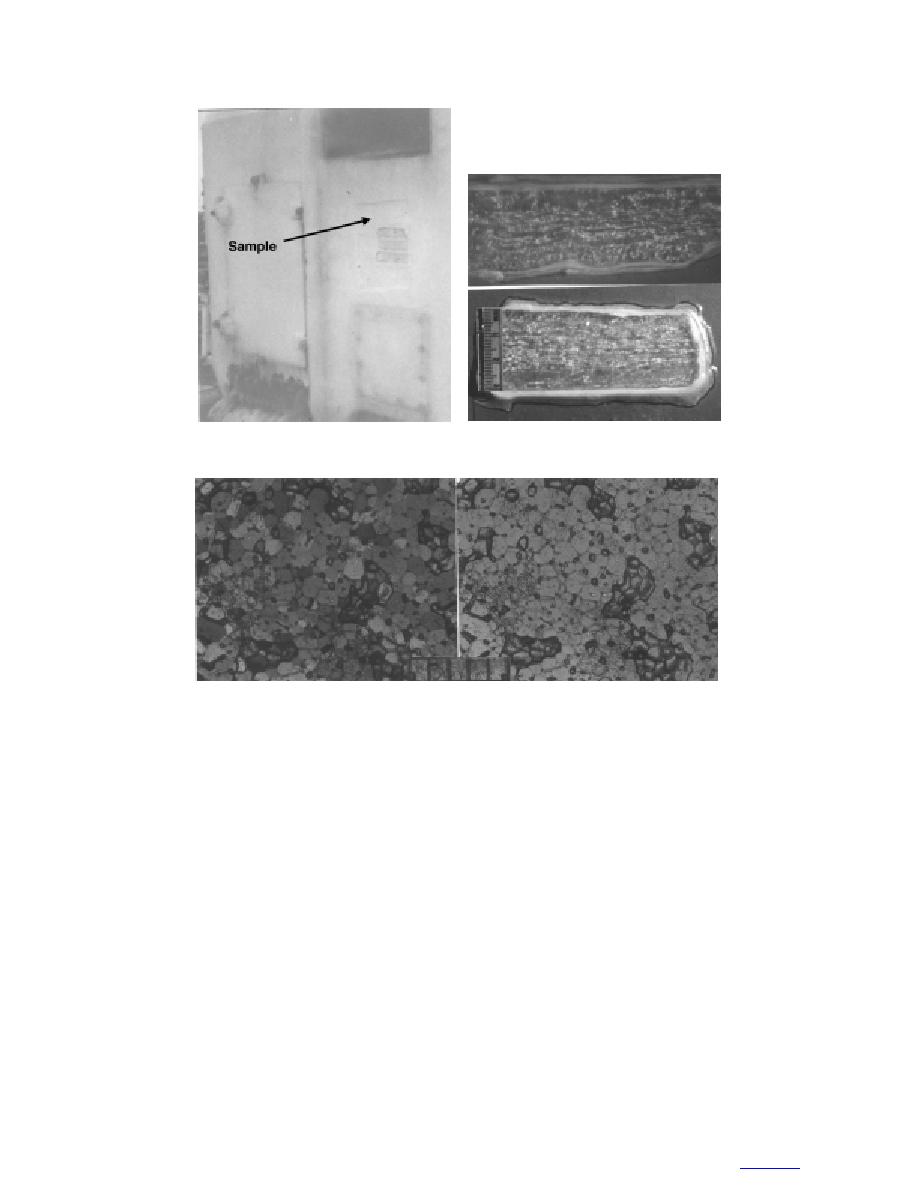
b. Thick sections photographed in
a. Sample location.
natural light.
c. Horizontal thin sections photographed in natural light (right) and
between crossed polarizers (left).
Figure 14. Sample F7, taken from the forward face of the 5-in. gun mount
(scales in millimeters).
Both exhibit strong layer structure in thick sections.
of the 5-in. gun mount as indicated in Figure 8, at 1.1
However, the two samples differ appreciably in their
m above the deck surface (Fig. 14). This particular
overall physical properties, as indicated in Tables 2 and
sample displays clearly defined layer structure, testify-
ing to the episodic nature of ice accretion on the verti-
3. Sample F8, obtained 0.2 m below sample F7, is both
cal face of the gun mount. Crystal shape varies from
less dense and less saline than sample F7, resulting in
subrounded to polygonal, with crystal cross-sectional
correspondingly significant differences in the derived
areas averaging 0.62 mm2. The structure also included
values of brine and entrapped air volumes. Crystal tex-
regions of localized brine entrapment. A bulk salinity
tures are similar in both samples, but crystal sizes are
of 16.2‰ was measured in conjunction with a mea-
appreciably smaller in sample F8. These results further
sured density of 0.773 Mg m3. Derived values of brine
indicate the variability in properties that can exist in
and entrapped air volume, calculated at the in-situ tem-
neighboring samples of the same icing event.
perature of 8.0C, of 9 and 17.6% were obtained.
Sample F9. This sample measured 1.9 cm thick
Sample F8. This sample (Fig. 15) was obtained
and was obtained from the vertical panel installed by
from the same general location as sample F7 (Fig. 14).
personnel from the U.S. Navy David Taylor Model
18
to contents


 Previous Page
