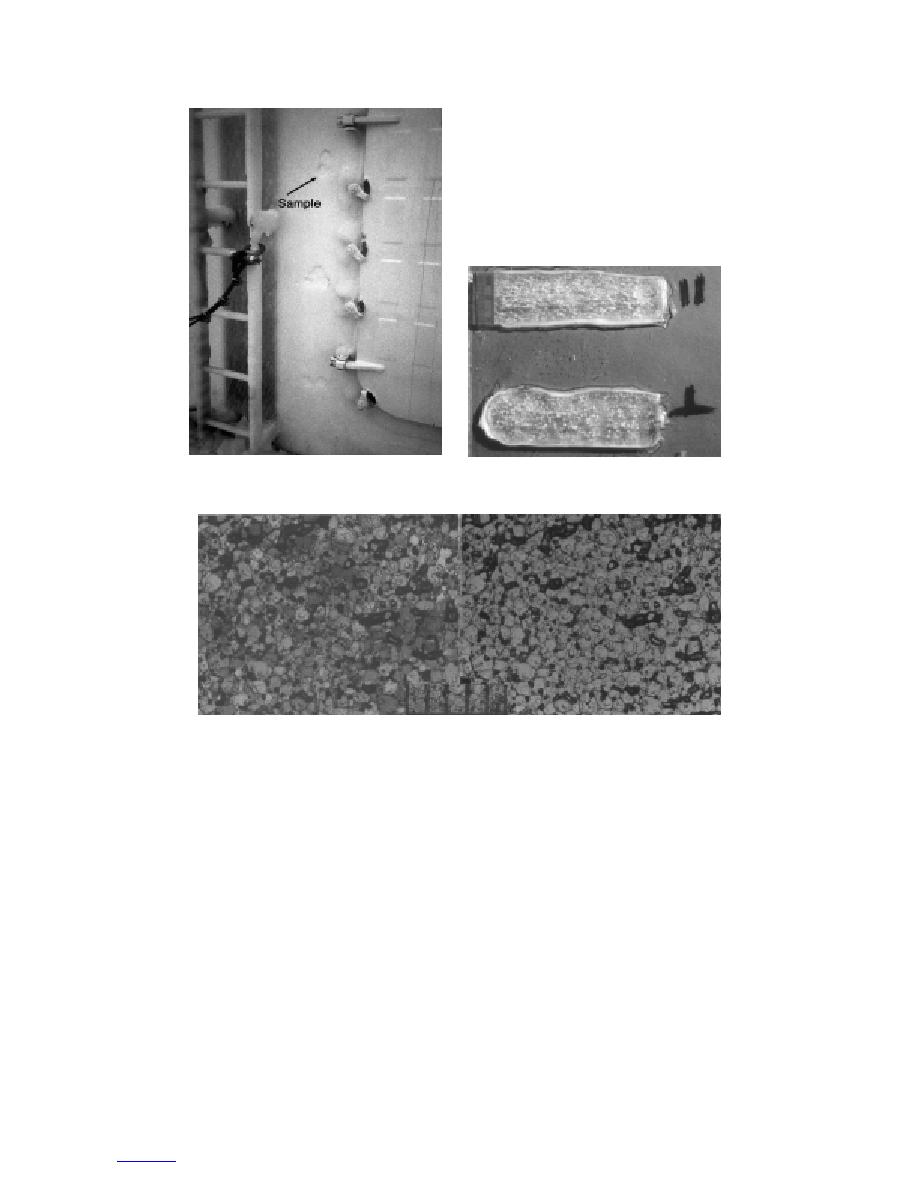
b. Thick sections photographed in
a. Sample location.
natural light.
c. Thin sections photographed in natural light (right) and between crossed
polarizers (left).
Figure 13. Sample F5, taken about 1.5 m above the deck surface on the face
of the forward bulkhead (scales in millimeters).
values of brine and entrapped air volume calculated at
nificantly denser, leading also to appreciable differences
the in-situ temperature of 7.8C are 7.9 and 18.6%,
in the derived values of the entrapped air and brine vol-
respectively.
umes. Those differences indicate either less brine was
incorporated initially or that the region from which
Sample F5. This is a bulkhead sample (Fig. 13)
sample 5 was collected underwent somewhat greater
obtained 1.5 m above the deck and from the same gen-
brine drainage after deposition than nearby samples F3
eral location as samples F3 and F4. Crystal size was
and F4, perhaps because of the greater height of sample
very similar to that of sample F4. However, as indi-
F5 above the deck.
cated in Tables 2 and 3, other physical properties of
Sample F7. This sample was taken from the same
sample F5 differ appreciably from those measured on
samples F3 and F4. Sample F5 is less saline, but sig-
general location as sample F8, from the forward face
17
to contents


 Previous Page
