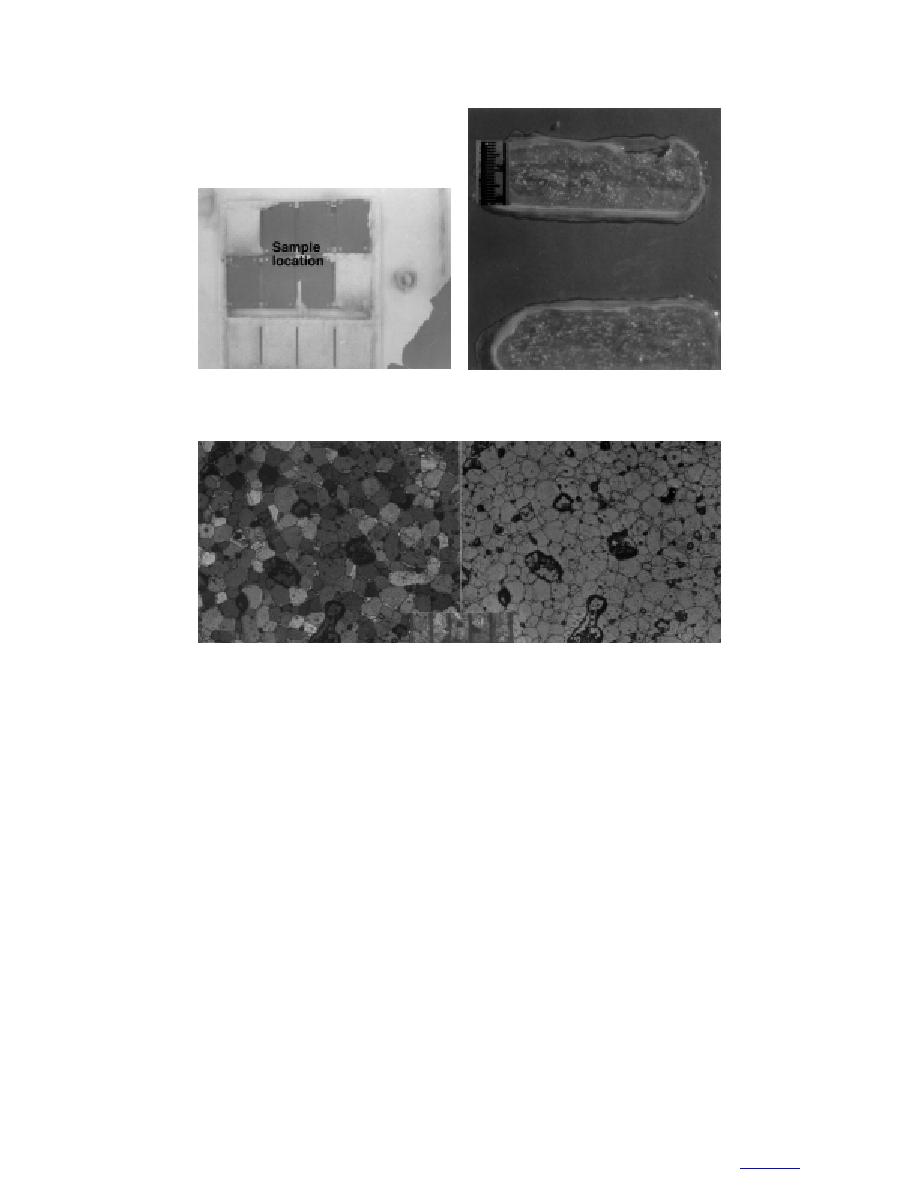
a. Sample location.
b. Thick sections photographed in
natural light.
c. Thin sections photographed in natural light (right) and between crossed
polarizers (left).
Figure 16. Sample F9, taken from the DTMB ice panel on the starboard
forward bulkhead (scales in millimeters). The test panels stand off from the
bulkhead surface, allowing cold air to circulate behind them. This allowed
ice on the panels to be colder than ice on the adjacent bulkhead.
and F6), no preferred orientation of crystals was appar-
associated with the episodic spraying and drying pro-
ent, based on observations of the pattern of interfer-
cess of sea spray accretion, or with the sloshing of
ence colors displayed when crystals are rotated between
water trapped on the deck by frozen scuppers. The mean
cross-sectional area of crystals measured 0.63 mm2,
crossed polarizers.
equivalent to a root-mean-square diameter of 0.79 mm.
Horizontal surfaces
Crystals are generally subrounded, though some
Sample F1. This is a deck sample, as indicated in
straightening of the grain boundaries is also apparent.
Figure 8, having 3.2-cm-thick ice with a mean density
A variety of inclusion structures is present, either con-
0.895 Mg m3 and characterized by a high salinity of
centrated along grain boundaries or located at multigrain
24.0‰ (Fig. 17). The salinity data, in conjunction with
intersections. Larger, often irregularly shaped inclusions
the in-situ temperature of the accreted ice and its den-
are identified as brine pockets; smaller, generally
sity, yielded a total porosity of 19.2%, consisting of
rounded inclusions are tentatively identified as air
13.7% of brine by volume and an entrapped air content
bubbles. Bubbles average 0.26 mm in diameter or about
of 5.5%. Vertical thick section slices in Figure 17 clearly
one-third that of the crystals. Crystal orientation is ran-
demonstrate the layered nature of the ice. This may be
dom, based on observations of the interference colors
20
to contents


 Previous Page
