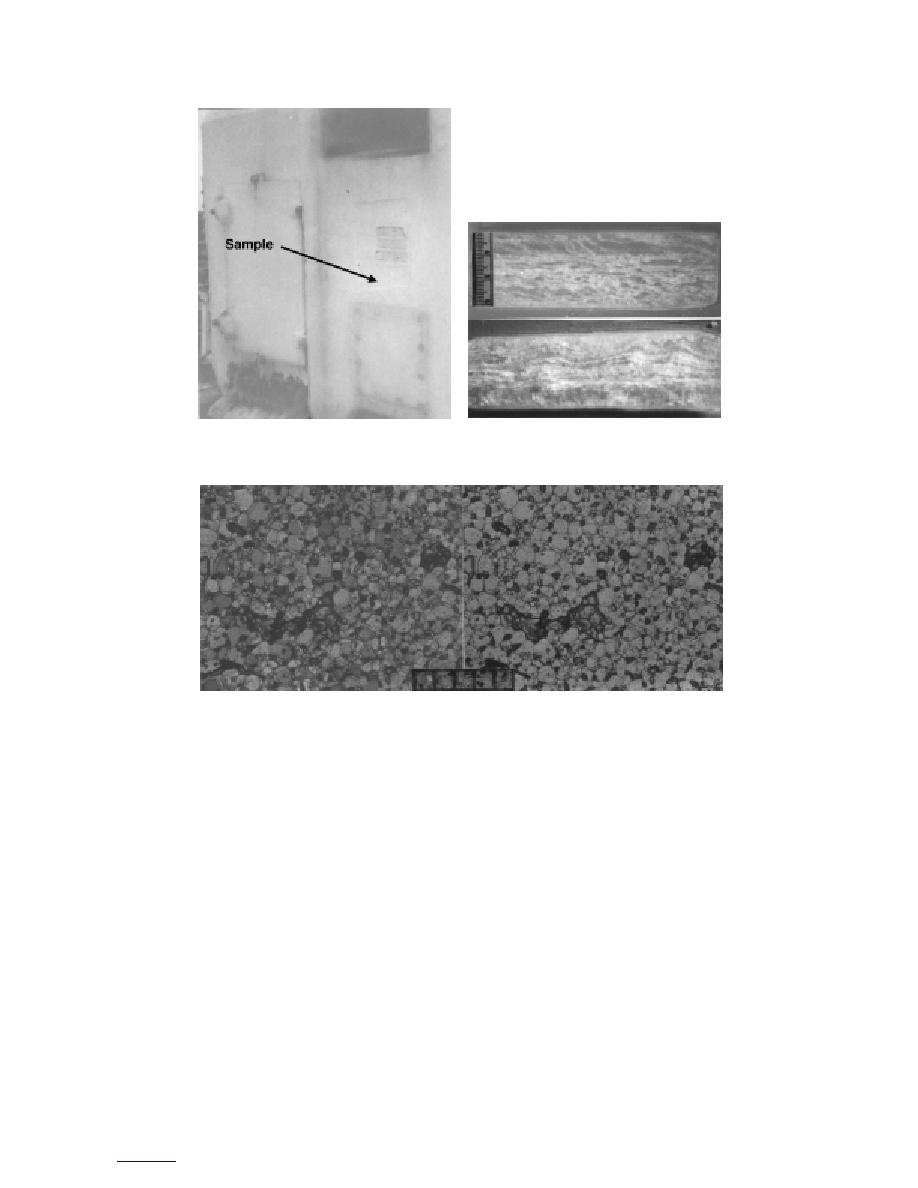
a. Sample location.
b. Thick sections photographed in
natural light.
c. Thin sections photographed in natural light (right) and between crossed
polarizers (left).
Figure 15. Sample F8, taken 0.9 m above the deck (0.2 m below sample F7)
on the forward face of the 5-in. gun mount under the barrel (scales in milli-
meters). Layering is very strongly developed in this sample.
Basin (DTMB) on the starboard forward bulkhead (Fig.
accreted ice is the widespread occurrence of polygonal
16). Compared to other samples collected during this
crystals. These grew in lieu of rounded or even shape-
icing event, the F9 sample was both the least dense
less grains that could be expected of water droplets when
(0.693 Mg m3) and the least saline (11.5‰). Com-
they strike the deck or superstructure of a ship and
bined with an estimated in-situ measurement tempera-
freeze. Most of the grain boundaries show minimal
ture of 8C, the densitysalinity characteristics of the
curvature, and 120 multigrain intersections are domi-
ice yielded a derived value of 25.7% for the entrapped
nant. It cannot be determined just when this apparent
air volume, but only 5.7% for the volume of brine
conversion to polygonal grains took place, but the fact
trapped in the ice. The mean size of bubbles in the ice
that it has happened emphasizes the importance of thin
(0.29 mm) was also the largest measured on any sample
sectioning samples as soon as possible after the initial
from the February icing event. The crystal size was also
accretion, or even during the accretion process, to cap-
the largest measured, as indicated in Table 3. An addi-
ture the true condition of the crystal structure. As also
tional feature of the microstructure of this sample of
applies to previously discussed samples (F1, F3, F4,
19
to contents


 Previous Page
