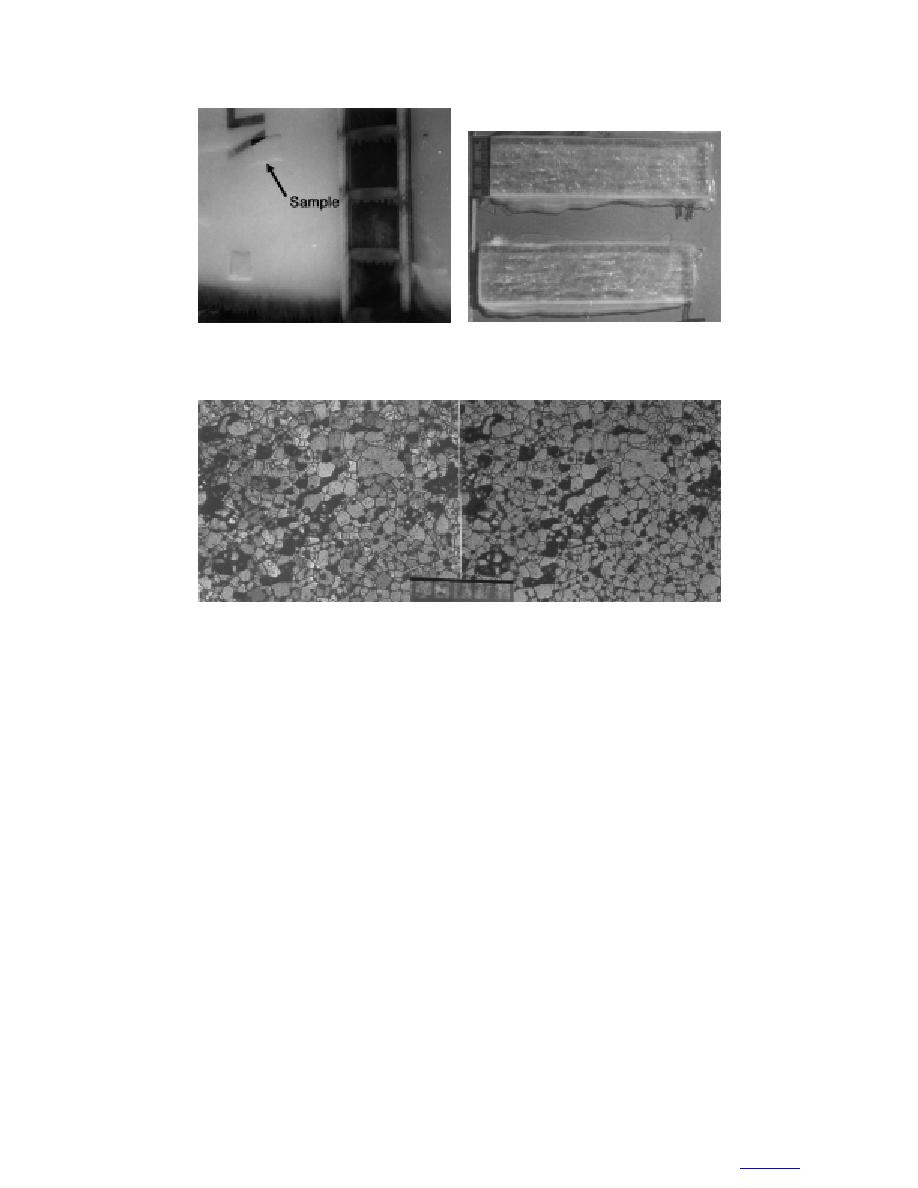
b. Thick sections photographed in
a. Sample location.
natural light.
c. Thin sections photographed in natural light (right) and between crossed
polarizers (left).
Figure 23. Sample M9, taken from the port bulkhead of the 5-in. gun hous-
ing, 1.8 m above the deck surface (scales in millimeters).
grains and straight-sided crystals, exhibiting occasional
appears to have undergone some incipient recrystalli-
120 intersections. The latter would indicate partial
zation. A density of 0.827 Mg m3 was measured,
recrystallization of the ice at some stage of its structure
which, together with a bulk salinity of 9.8‰ mea-
sured at the in-situ temperature of the sample, 2.8C,
evolution. A mean cross-sectional area of crystals of
0.58 mm2 (and its diameter equivalent of 0.76 mm) was
yields derived values for the brine and entrapped air
measured in conjunction with a mean bubble diameter
volumes of 15.2 and 12.0%, respectively. A mean gas
of 0.24 mm.
bubble diameter of 0.24 mm was also measured, which
is about four times smaller than the average diameter of
Sample M14. Samples of ice were retrieved from
crystals.
this particular location, situated between 1.2 and 1.5 m
Horizontal surfaces
above the deck on the front face of the 5-in. gun imme-
Samples M1 and M2. No sections, nor density,
diately under the barrel, at three different times during
the March icing event. The sample analyzed here (Fig.
nor porosity data were obtained from these very thin
25) measured 1.1 cm thick and was taken at the end of
samples (0.6 cm). Only bulk salinities, of about 25‰,
the March event. This sample contained the largest crys-
were measured on these thin, soft, mushy deck-accreted
tals of all the vertically accreted ice samples that we
samples.
examined; they averaged 1.05 mm2 in cross section,
Sample M8. This sample was obtained from 4.4-
which converts to a root-mean-square diameter of 1.02
mm. Microstructurally, the ice in this particular sample
cm-thick ice accreted on the deck, 23 m port of the 5-
26
to contents


 Previous Page
