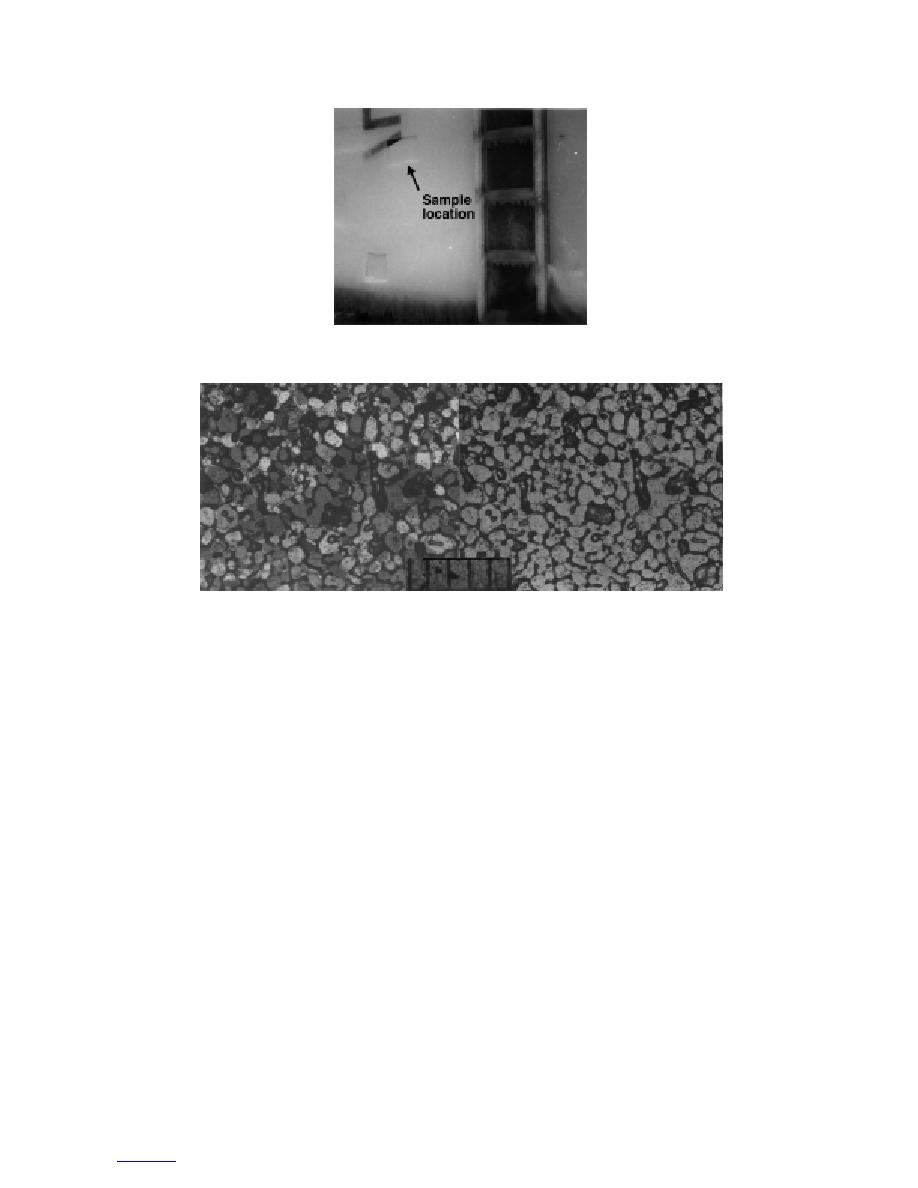
a. Sample location.
b. Thin sections photographed in natural light (right) and between crossed
polarizers (left).
Figure 22. Sample M6, removed from the port face of the 5-in. gun mount
(scale in millimeters). Thick sections photographed in natural light are not
available. Air temperature was near 0C when this sample was taken.
mersed in brine, as indicated in an enlarged section of
deposition at the elevated temperatures of this event
(see Fig. 7); 120 multigrain intersections are
this sample shown in Figure 10.
especially prominent. A density of 0.877 Mg m3 was
Sample M7. This sample, obtained from 1.2-cm-
measured, which, together with a measured bulk salin-
thick ice from the same general location as samples
ity of 7.5‰, yields derived values of 6.0 and 11.5% for
M6, M9, and M10, yielded a bulk salinity of 8.6‰ and
the entrapped air and brine volumes, respectively, at
the measured in-situ temperature of 3C.
a density of 0.872 Mg m3. No thin sections of this
sample were prepared.
Sample M10. This sample (Fig. 24), measuring 3.4
Sample M9. This sample (Fig. 23) was obtained
cm thick, was taken from a bulkhead located on the
1.8 m above the deck from vertically accreted ice, 2.3
port side of the 5-in. gun at a height of 0.9 m above the
cm thick, from the same general location as sample M6
deck. Thick sections cut perpendicular to the accretion
(Fig. 22), but 16.5 hours later. Structurally, this sample
surface show evidence of layering. A relatively low bulk
of accreted ice consisted of polygonal crystals of aver-
salinity of 7.0‰ was measured; this, in conjunction with
age cross-sectional area of 0.50 mm2, incorporating
a measured density of 0.882 Mg m3 at an in-situ tem-
perature of 3C, yields derived values of 10.8 and 5.3%
numerous bubbles and inclusions of brine. The sharply
polygonal outlines of the crystals indicate that ice at
of brine and entrapped air volume, respectively. The
this particular location may have recrystallized after
microstructure is composed of a mixture of rounded
25
to contents


 Previous Page
