0.01
0.00
-0.01
-0.02
-0.03
-0.04
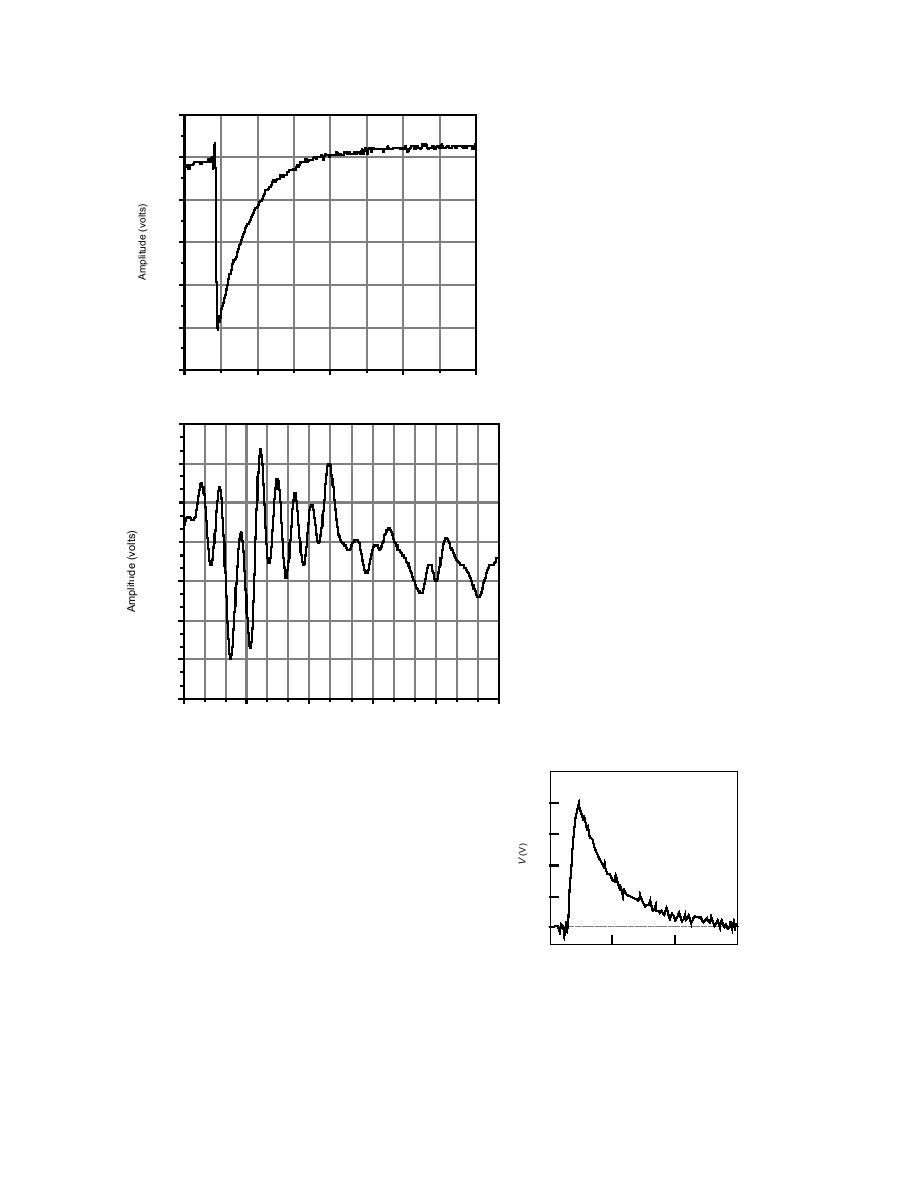
Figure 22. Electrical signal of a microcrack in fresh-
water columnar ice (after Fifolt et al. 1993). T =
33C, σ = 6.3 MPa.
-0.05
0
1
2
3
4
Time, ms
0.006
0.004
0.002
0.000
-0.002
-0.004
Figure 23. Electrical signal of a large crack
splitting many columns in freshwater colum-
-0.006
nar ice (after Fifolt et al. 1993). T = 30C,
σ = 3.78 MPa.
-0.008
0
20
40
60
80
100
0
0 Time (s) 0
0
0
split electrically pre-polarized ice, causing the appear-
1.5
ance of growing or oscillating electrical dipoles (see
the theoretical section above). This mechanism was
1.2
later proven in experiments in which a strong external
0.9
electrical field was applied to ice samples with grow-
ing cracks (Petrenko 1993d). It was shown that in this
0.6
case the magnitude of electrical signals from cracks is
proportional to the external electrical field E⊥, in ac-
0.3
cordance with eq 33. An example of a signal generated
by a microcrack in the presence of an external electri-
0
cal field is shown in Figure 24. Again, the decay time
2
0
3
1
of the signals coincided with the slow dielectric relax-
t (ms)
ation time τ2.
Figure 24. Typical electrical signal cap-
Electrical polarization of ice, induced by a stable
tured from a microcrack in freshwater
crack, attributable to the pseudo-piezoelectric effect,
ice under the action of an external elec-
tric field E⊥ = 10 V/cm. T = 10C, crack
was studied using the scheme depicted in Figure 25 to
dimensions 2 2 cm (after Petrenko
determine electrical field distribution around the crack
1992a).
(Petrenko 1992a). Narrow cracks prepared by a thin
18


 Previous Page
