(1)
(2)
(3)
(4)
(5)
(6)
(7)
(8)
30000
3000
300
1. Fast 1-year ice, 100130 cm, snow 20 cm,
hummocks
30
2. Marine ice 6080 cm, hummocks, snow 20 cm,
compression
3. Ice fields with open pools
4. Fresh, snow-free ice 3040 cm, compression
5. Large open pools, ice-free water, tow vessel
100
released and 180 turn made
6. Fresh ice with open pools
10
7. Ice fields with open pools
8. Passage into solid ice.
0
16
20
12 16 20
00
08 12
16
12
00
04
08
04
t (hours)
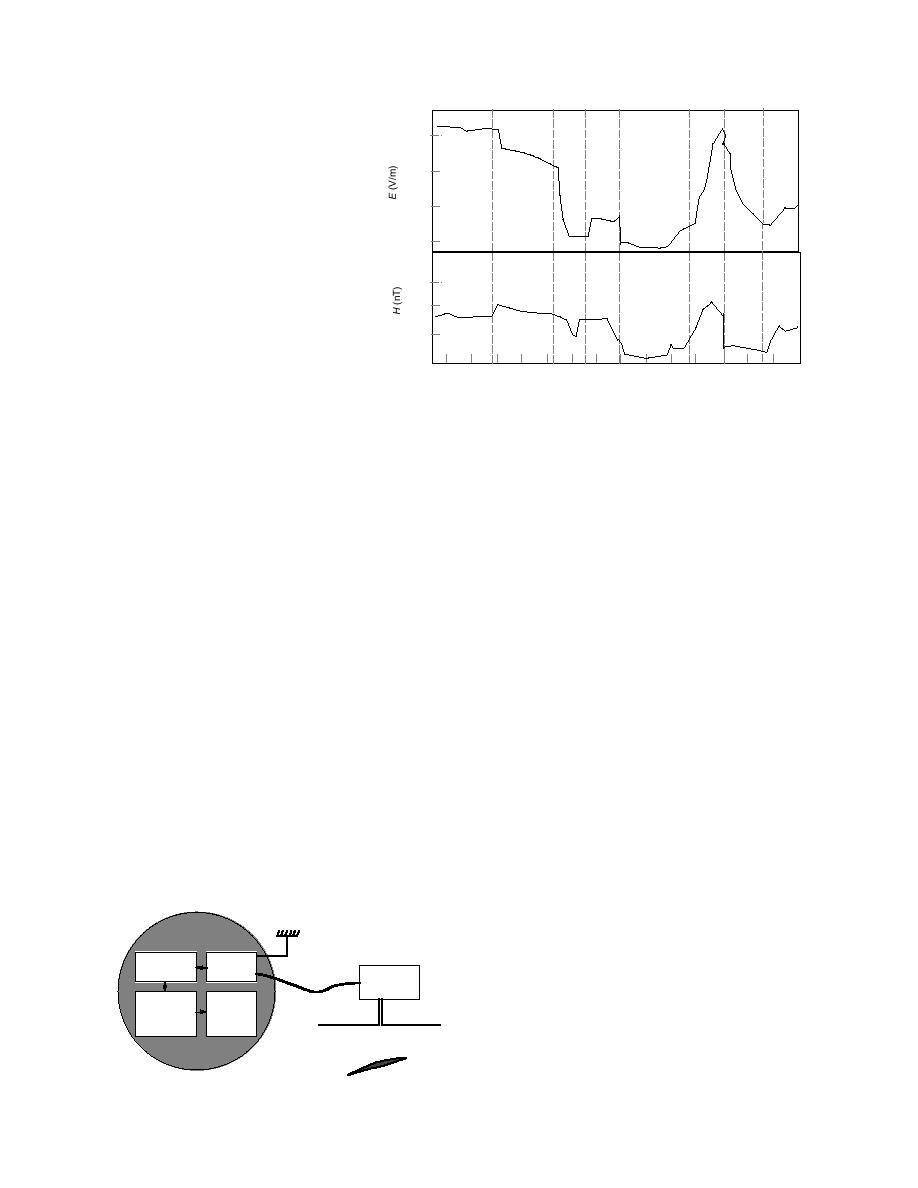
Figure 28. Synchronous 3-day en route measurements of electric (top) and magnetic (bottom) fields (after Kachurin
et al. 1988).
m using a magnetic ferrite antenna connected to a selec-
200 Hz to 2 kHz. The researchers picked this frequency
tive amplifier. The amplifier was tuned to the frequency
range to minimize the level of natural and industrial
of 100 kHz. An equivalent sensitivity of the measuring
electromagnetic interference and to allow subsequent
system equaled 2 V/(mV/m), and an equivalent noise
satellite measurements through the ionospheric radio
level was 0.3 mV/m. The plane flew above various re-
propagation window in the ELF range. An equivalent
ambient noise was about 1010 T while the signals usu-
gions such as open water, thin ice and thick ice during
different wind conditions. Strong wind loads the ice,
causing intensive cracking, hummocking and deforma-
Figure 28 shows the results of synchronous measure-
tion. They found that the strength of the electromagnet-
ments of the electrical and electromagnetic fields made
ic field increased to 58 mV/m above the regions with
in ice sheets of various thicknesses and ages. Icebreaker
intensive ice deformation, while without wind loading
velocity and electrical and magnetic field strengths cor-
or above open water, variations of EME did not exceed
related over a much shorter time scale of several min-
0.5 mV/m as measured on different days.
utes. The electrical and magnetic fields measured in
During the navigation period of 1986, the electrical
these experiments may be caused by both EME from
and electromagnetic fields arising from a fracturing of
cracks and frictional electrification of ice and snow gen-
the ice cover during ship passage were measured from
erated by the icebreaker passing through the snow-cov-
the nuclear icebreaker Arktika (Kachurin et al. 1988). A
ered ice.
dynamic electrometer was used for the measurements
Petrenko and Gluschenkov (1995) reported field
of electrostatic fields in the range of 10 to 105 V/m. The
measurements of EME from individual cracks in fresh-
electrometer was on a movable arm mounted 11 m
water lake ice, and Gluschenkov and Petrenko (1993)
above the waterline at the bow of the icebreaker. Elec-
did the same with first-year sea ice. The electrical com-
tromagnetic pulses were recorded with an induction
ponent of the EME from cracks was measured with an
transducer having a ferrite core with a resonance fre-
experimental setup shown schematically in Figure 29.
quency of about 1 kHz. The signals were amplified by a
A 10-m-long dipole antenna was stretched horizontally
selective microvoltmeter in the frequency range from
1 m above the ice surface. The antenna was connected to
preamplifier. The high input impedance together with
Ground
abled us to measure electrical fields in a wide frequency
Amplifier
Filters
Cable 100 m
Pre-amplifier
Digital
Computer
Antenna
Figure 29. Experimental configuration used in meas-
urements of EME from cracks in lake and sea ice (after
Gluschenkov and Petrenko 1993).
Ice field
Crack
21


 Previous Page
