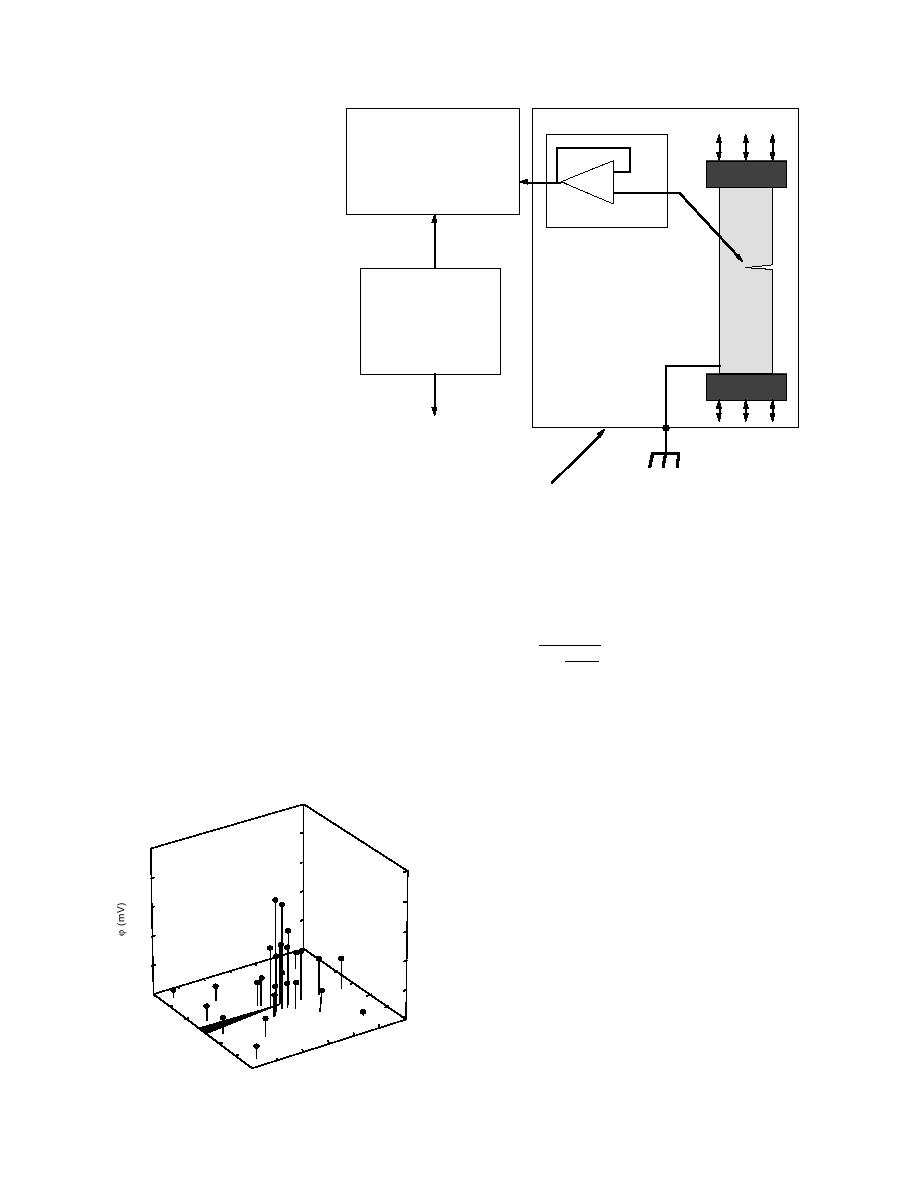
Lock-in
amplifier
MTS
testing machine
IcIce
e
s
Figure 25. Schematic of experimental configuration used in
measurements of electric fields on the ice surface around a
stable crack (after Petrenko 1992a).
Shielded box
bandsaw (1 mm thick) were located in the middle of
Figure 26 shows the distribution of the amplitude of
an oscillating electrical potential ϕ measured around
the samples, perpendicular to their long side. Sample
dimensions were 15 6 6 cm3 and the crack length
an artificial mode I tearing crack. To compare these
experimental results with the theory, ϕ was calculated
varied from 5 to 30 mm. An oscillating sine wave, of
frequency from 1 to 300 Hz, was applied to the sam-
using eq 51
ples by an MTS testing machine. In this set of meas-
εiiα j
ϕ=
urements, a sine potential difference was measured by
(53)
Φεε0
ej +
a lock-in amplifier between one remote electrode
ej
mounted into the ice and one electrode placed near the
crack tip. This latter electrode in some cases was
where εii must be taken from eq 47 and αj = α4 = 6.2
mounted into the ice to a depth of 2 mm, by careful
eV (Evtushenko et al. 1987). There is satisfactory
heating of the electrode, or was attached to the ice sur-
quantitative and qualitative agreement between theory
face with slight pressure. The electrodes were made of
and experiment in the vicinity of the crack tip for r =
stainless steel wire of 0.1-mm diameter.
110 mm. At r = 1 mm, ϕ = 0.8 mV. Yet, at larger dis-
tances ϕ remains almost constant instead of decreasing
to 0 as the theory predicts (ϕ ∝ r 1/2; r is the distance
1.0
Sample dimensions 13 6.5 6.5 cm
0.8
Crack length l = 3 cm
Width d = 1 mm
0.6
T = 10C
0.4
Stress amplitude 0.12 MPa
Frequency 90 Hz
0.2
30
20
Figure 26. Amplitude of electric potential ϕ on the surface of
10
30
0
20
the ice sample measured in the configuration shown in Fig-
10
y
(m 10
0
m
ure 25; large grains of ice grown from deionized water (after
10
m)
)
20
x (m
20
Petrenko 1992a).
30 30
19


 Previous Page
