though there was large scattering in the data, signifi-
T (C)
cant charge separation was observed only in the pres-
40
80
120
80
40
120
ence of a temperature gradient ∇T and, hence, E⊥. An
20
average of that set of the results fits well to the predic-
tion given by eq 33.
15
Electrical signals from thermocracks in ice single-
and polycrystals were studied by del Pennino et al.
(1974). Their ice specimens were frozen on the top of a
10
massive copper substrate that was also used as the first
electrode. The second electrode, connected to a lock-in
amplifier, was vibrated above the ice surface to mea-
5
sure the icemetal contact potential (Kelvin method).
Thermocracks were produced during intensive cooling
of the copper substrate because of the difference in the
0
thermal expansion coefficients of copper and ice. The
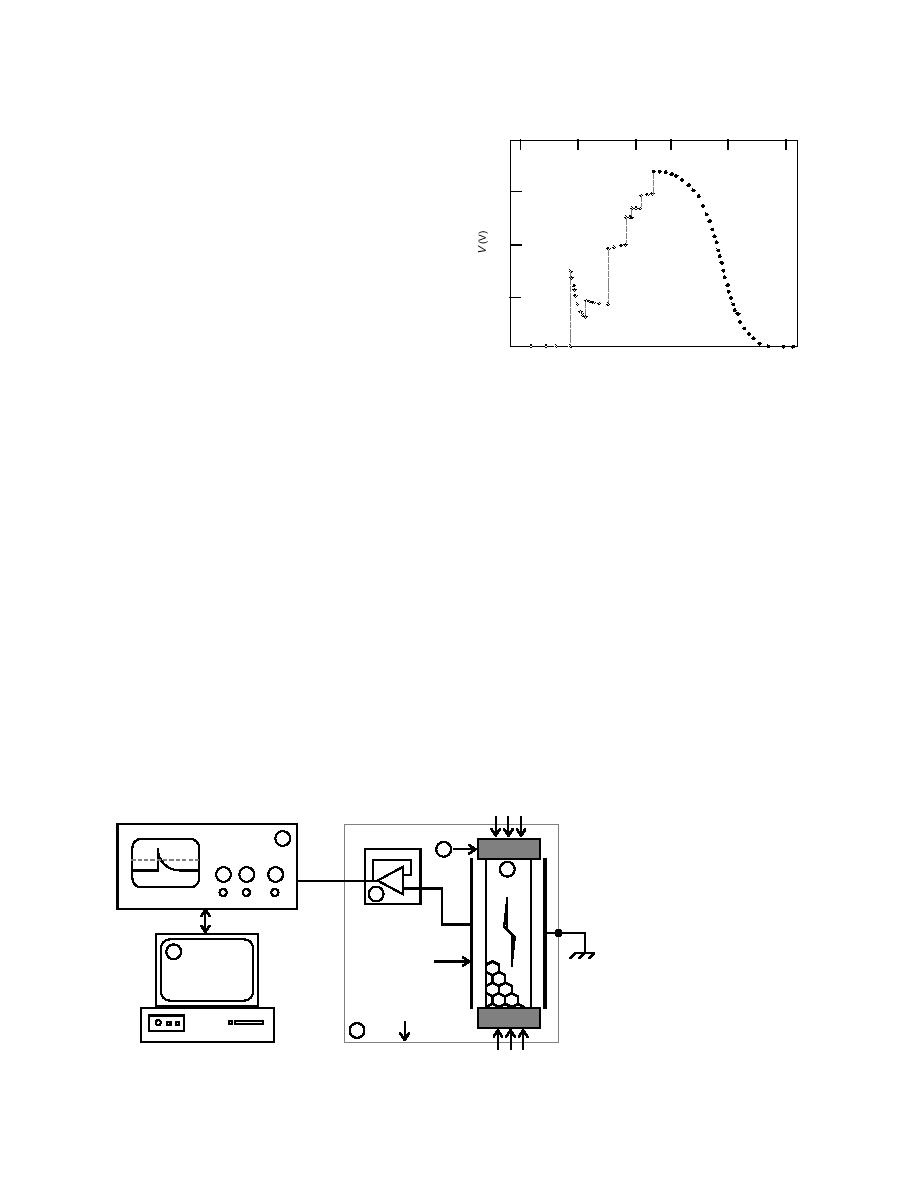
Figure 20. Jumps of electric potential V caused by
cracks in the ice (which were assumed to be mode I
nucleation of thermocracks (after del Pennino et al.
type) grew in prismatic planes of ice single crystals,
1974). Open circles show V during freezing at a con-
starting from the copper substrate toward the mobile
stant rate of 0.5C/min; solid circles show V under
warming at a rate of 0.35C/min.
electrode. Figure 20 depicts several such events. The
potential jumps associated with crack nucleation
measured from one to several volts and were
electrical potential difference between two metal elec-
characterized by very long relaxation time. The relax-
trodes, which were either attached to an ice specimen
ation time varied from 102 seconds at 20C to 104
(thin foil electrodes) or placed at some distance from
seconds at 100C. While the signals' amplitude can
the specimen surfaces (see Fig. 21).
be explained in terms of the pseudo-piezoelectric po-
Observed signals ranged in amplitude from 4 to 70
mV and lasted from 1.5 104 to 102 seconds. Most
larization of ice induced by cracks, their too-long re-
laxation time does not correspond to any electrical re-
commonly, the signals exhibited an exponentially
laxation time known for ice. That time may corre-
decaying form (Fig. 22). Independent measurement
spond, as the authors suggested, to relaxation of elastic
showed that the signals' delay time coincided with the
slow dielectric relaxation time τ2 (see eq 37). The signal
stress in ice.
Fifolt (1990, 1991) and Fifolt et al. (1992, 1993)
type shown in Figure 22 was typical for small cracks
found and investigated electrical signals from cracks
that either split one ice grain or were located on one
in freshwater columnar and granular ice under uniaxial
intergranular boundary. Oscillating, sinusoidal type sig-
compression. Temperature gradients and other possi-
nals were characteristic for large cracks that split many
ble sources of external electrical fields were absent in
single-crystalline grains or columns (Fig. 23).
these well-controlled experiments. The measurements
The nature of such signals was understood after the
were performed in a temperature range from 10 to
discovery of the frozen-in, intrinsic electrical field in
33C. Electrical signals from cracks appeared as an
polycrystalline ice (Petrenko 1992a). Cracks in such ice
e
Storage
b
Scope
a
Ice
d
+ -
+ -
Preamp.
+ -
+ -
+ -
+ -
f
+ -
Electrode
+ -
a. Ice sample and electrodes.
computer
b. Synthane endcaps.
c. RF shielded enclosure.
d. High input impedance preamplifier.
Shielded box
e. Digital storage oscilloscope.
c
f. Computer.
MTS
Figure 21. Signal recovery system used to detect emissions (after Fifolt et al. 1993).
17


 Previous Page
