12
12
10
10
8
8
6
6
180
160
160
140
140
120
2.5
2.5
2.0
2.0
0
1.5
1.5
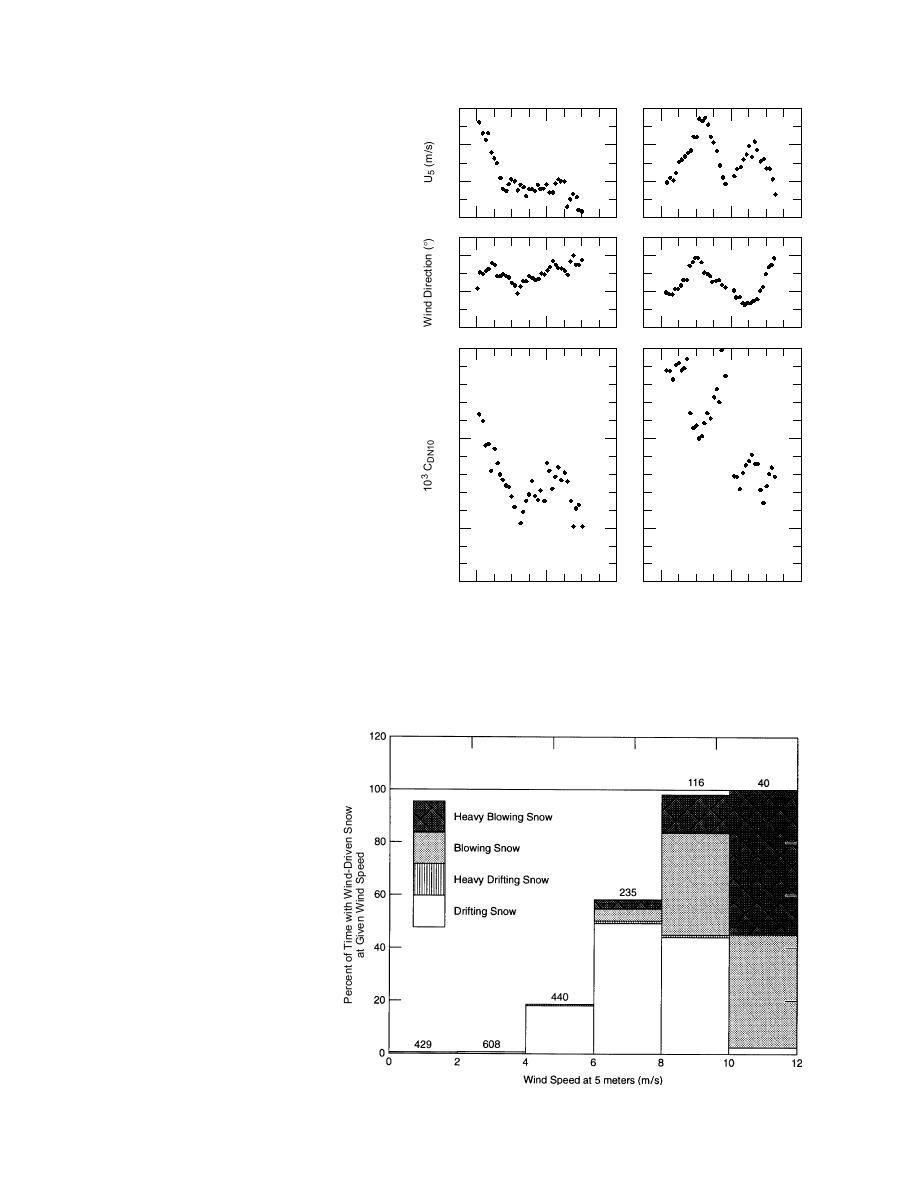
Figure 13. Two long events on Ice Station Weddell
that were characterized by a relatively constant wind
direction (hourly average). U5 is the hourly averaged
wind speed at a height of 5 m; the CDN10 values came
64
65
66
79
80
81
from Figure 12.
Julian Day
these data came from a single mast that did not move
On ISW we observed that snow generally began
with respect to the surrounding ice for the duration of the
drifting when the wind at 5 m reached 6 m/s. When the
experiment, the CDN10 values range from 1.27 103 to
wind reached 810 m/s, blowing and drifting snow were
2.54 103. And these values are not randomly scat-
virtually guaranteed. Figure 14 summarizes these ob-
tered but rather behave coherently with time. Figure 13
servations.
shows two long storm events extract-
ed from Figure 12. In each case, CDN10
decreased as the wind persisted from a
fairly constant direction and blew with
speeds of about 8 m/s or higher.
Figure 14. Ice Station Weddell ob-
servations showing the percentage
of the time with wind-driven snow
for a given 5-m wind speed. The
terminology follows National
Weather Service (1991) guidelines.
Above each histogram bar is the
number of hourly averaged wind
speeds within the indicated range.
19


 Previous Page
