3.0
Top
2.5
β
β
Φ
7
10
2.0
32
17
23
Wind
17
23
23
45
1.5
Side
Front
h
1.0
0
3
6
9
12
15
nh
mh
U10 (m/s)
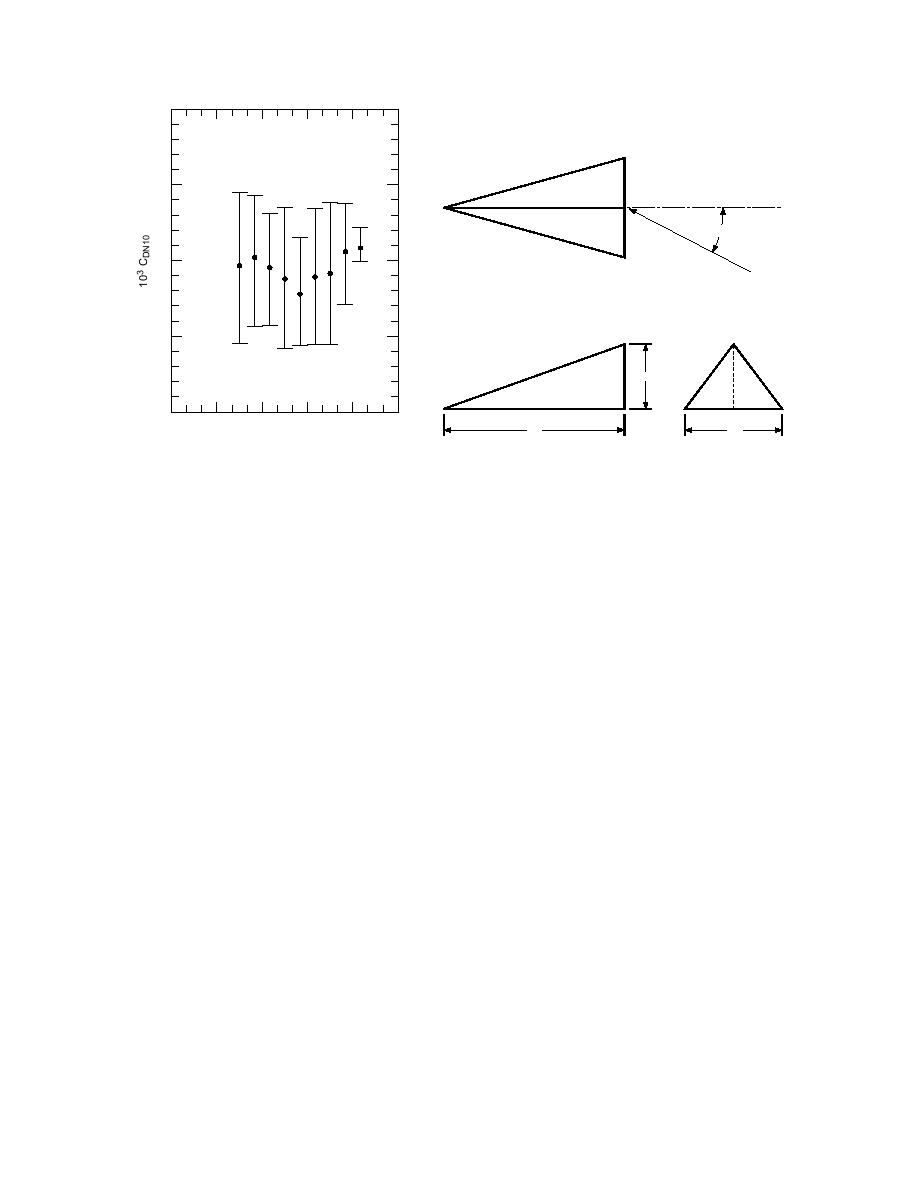
Figure 15. CDN10 values in Figure 12, averaged
Figure 16. Geometry of the sastrugi-like roughness elements
over 1-m/s bins of the 10-m wind speed; the filled
envisioned to dictate the drag coefficient over snow-covered
circle denotes this average. Next to each circle is
sea ice. If the wind has been blowing above 68 m/s for
the number of CDN10 values in each bin. The verti-
1012 hours, the sastrugi will be aligned with the mean
wind direction; Φ will then be 0.
cal bar indicates the 90% confidence interval for
the population within each bin, assuming a beta
distribution with lower limit 1.2 103 and upper
limit 2.60 103 (Harr 1977, p. 495 f.).
We thus inferred that, for most of the hourly values
rudimentary sastrugi-like roughness elements that I treat
depicted in Figure 13, wind-driven snow was present
with the model. Although we made no formal observa-
(Andreas and Claffey 1995). As a result, the decrease in
tions of sastrugi or surface texture on ISW, we often
the CDN10 values during the two events suggests that
saw that high wind sculpted the snow surface into linear
snowdrifts perpendicular to the wind were eroding, and
drifts that looked like Figure 16. Figure 9 supports these
this snow was depositing in drifts that tended to stream-
casual observations; it shows that the snow collected
line the surface in the mean wind direction. This stream-
around protrusions in the sea ice surface but that the re-
lining lowered the aerodynamic roughness and therefore
sulting drifts were generally small. Hence, I assume that
the drag coefficient.
the typical sastrugi height, h in Figure 16, was roughly
Visual inspection of Figure 13 may suggest that the
1015 cm on ISW.
behavior of CDN10 is simply a wind speed effect: Lower
Figure 17 shows model predictions of how CDN10
CDN10 values seem to be associated with lower wind
depends on the wind's orientation with respect to the
long axis of the sastrugi (Φ in Fig. 16). In the figure, γ is
speeds. But looking at the entire ISW set of drag coeffi-
cients (Fig. 15) does not corroborate this speculation.
the fractional surface coverage of the roughness elements
CDN10 does not have any obvious dependence on the
depicted in Figure 16. Notice, because of the geometry
wind speed for speeds between 4 and 14 m/s. Likewise,
of the modeled sastrugi, the maximum possible value of
γ is 0.50.
Shirasawa (1981) found no wind speed dependence in
drag coefficients measured over snow-covered lake ice
Figure 17 reproduces some of the observations that I
for winds up to 11 m/s, and Inoue (1989) also found no
have been describing. When the wind is well aligned
(within 15) with the sastrugi, CDN10 has a minimum.
wind speed dependence at Mizuho Station on the Ant-
arctic continent for winds up to about 15 m/s.
As the wind turns to blow more perpendicularly to the
To investigate further this hypothesis that streamlining
sastrugi (without being high enough to erode them),
CDN10 increases. For h = 15 cm and γ = 0.15, the model
of the surface by wind-driven snow has a major effect
on the airice drag coefficient, I (Andreas 1995a, 1995b)
predicts CDN10 values in line with what we observed on
ISW. The model yields CDN10 = 1.43 103 when the
developed a physically based form drag model follow-
wind is within 12 of head-on to the sastrugi, while on
ing Raupach's (1992) guidelines. Figure 16 depicts the
20


 Previous Page
