River Basin, which encompasses parts of Pennsyl-
events were reported in all of the primary drain-
vania, New York, and Maryland (White 1999b),
age basins in the two states: the Androscoggin (7),
can be searched using hydrologic unit code 0205.
Saco (26), Piscataqua (32), and Merrimack (154)
Similarly, a summary of ice events in the U.S.
basins in New Hampshire, and the Hudson (2)
Army Engineer District, St. Louis, can be devel-
and St. Lawrence (399) basins in Vermont. There
oped by searching the hydrologic unit areas in
were 453 reported ice events in the Connecticut
Missouri and Illinois that lie within it (White
River basin, which includes both states (261 in
1999a). Such general knowledge about the spatial
Vermont and 192 in New Hampshire).
distribution of ice jams can be useful (e.g., priori-
USGS documents, such as those by Green
tizing the allocation of resources for further study
(1964) and Wiitala (1965), and annual streamflow
of ice events).
records, are the data sources for about 74% of these
ice events, somewhat less than for the entire data-
base (over 85%). Among the other sources listed
Example of regional characterization:
are newspapers dating back to the 1800s and
New Hampshire and Vermont
An example of a regional characterization is
detailed ice investigations by the Corps of Engi-
provided by White (1995) for New Hampshire and
neers. The higher percentage of non-USGS sources
Vermont, which are joined by the Connecticut
means that the entries for New Hampshire and
River. In this example the goal is to determine in
Vermont may be slightly less spatially and tem-
general when and where ice events occurred and
porally biased than for the database as a whole.
what the damages were, so that ice events can be
Perception stage bias remains.
compared to open-water events. It is assumed that
There has been at least one ice event in New
the accuracy of database information is acceptable,
Hampshire or Vermont every year since 1932.
broadly characterizing ice jams in the two states,
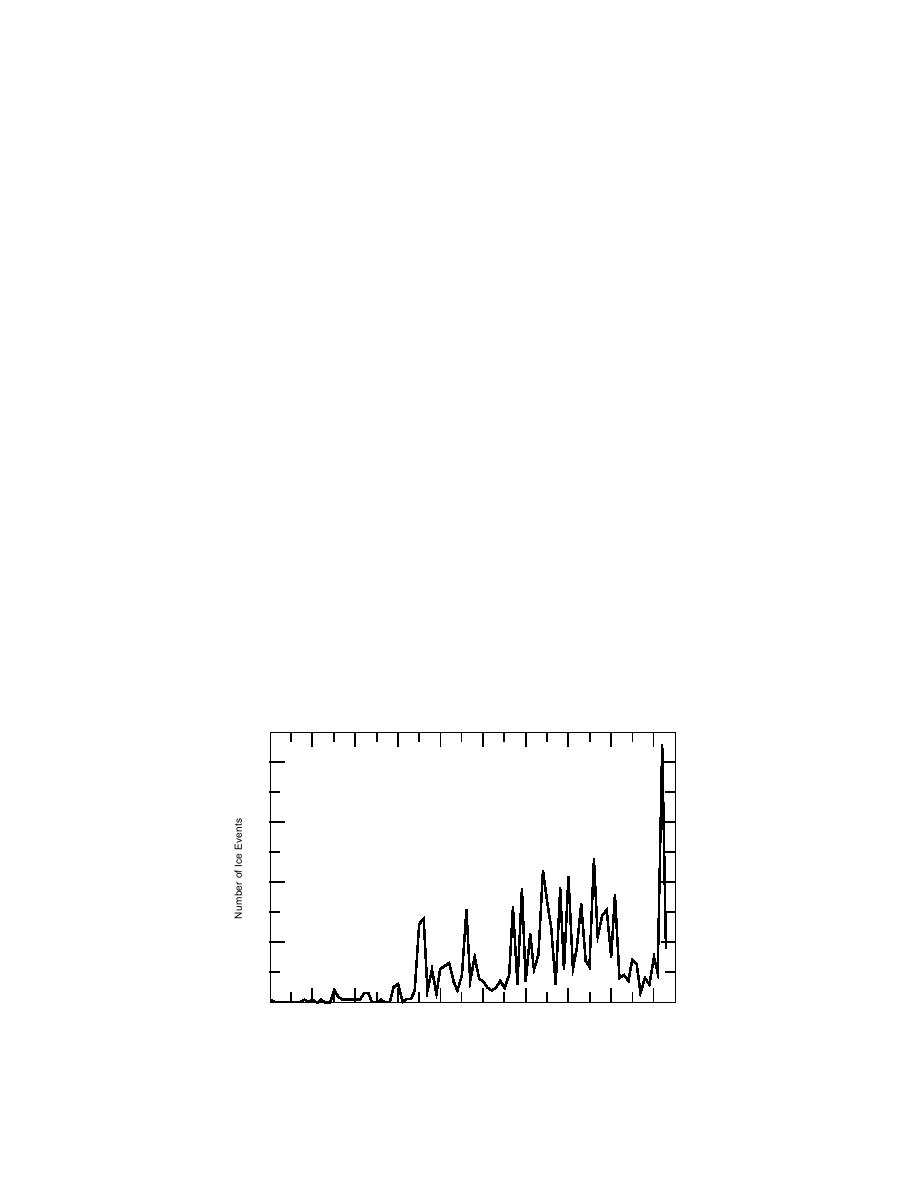
A plot of the distribution of ice event entries
and that the bias attributable to the unfinished
over time (Fig. 12) illustrates some of the tem-
nature of the database will be negligible.
poral biases in the database. For example, the
A search of the database revealed 1097 ice
high number of ice events reported for 1992 is
events: 667 in 90 towns or cities in Vermont and
the result of a survey of ice-related damage that
430 in 80 towns or cities in New Hampshire. Ice
occurred during ice cover breakup in March
events were reported at 248 locations on 146 dif-
1992 rather than an extremely unusual regional
ferent streams in New Hampshire and Vermont.
event. Similarly, the small number of ice events
Almost 34% of all reported ice events occurred on
reported before 1935 is more a reflection of the
just 5% of these streams, while 35% of the 146
data sources rather than actual event frequency.
rivers had only one reported ice event. Ice
There were few USGS gages in operation before
80
60
40
20
0
1900
1910
1920
1930
1940
1950
1960
1970
1980
1990
Water Year
Figure 12. Number of ice events recorded annually for New Hampshire
and Vermont (from White 1995).
12


 Previous Page
