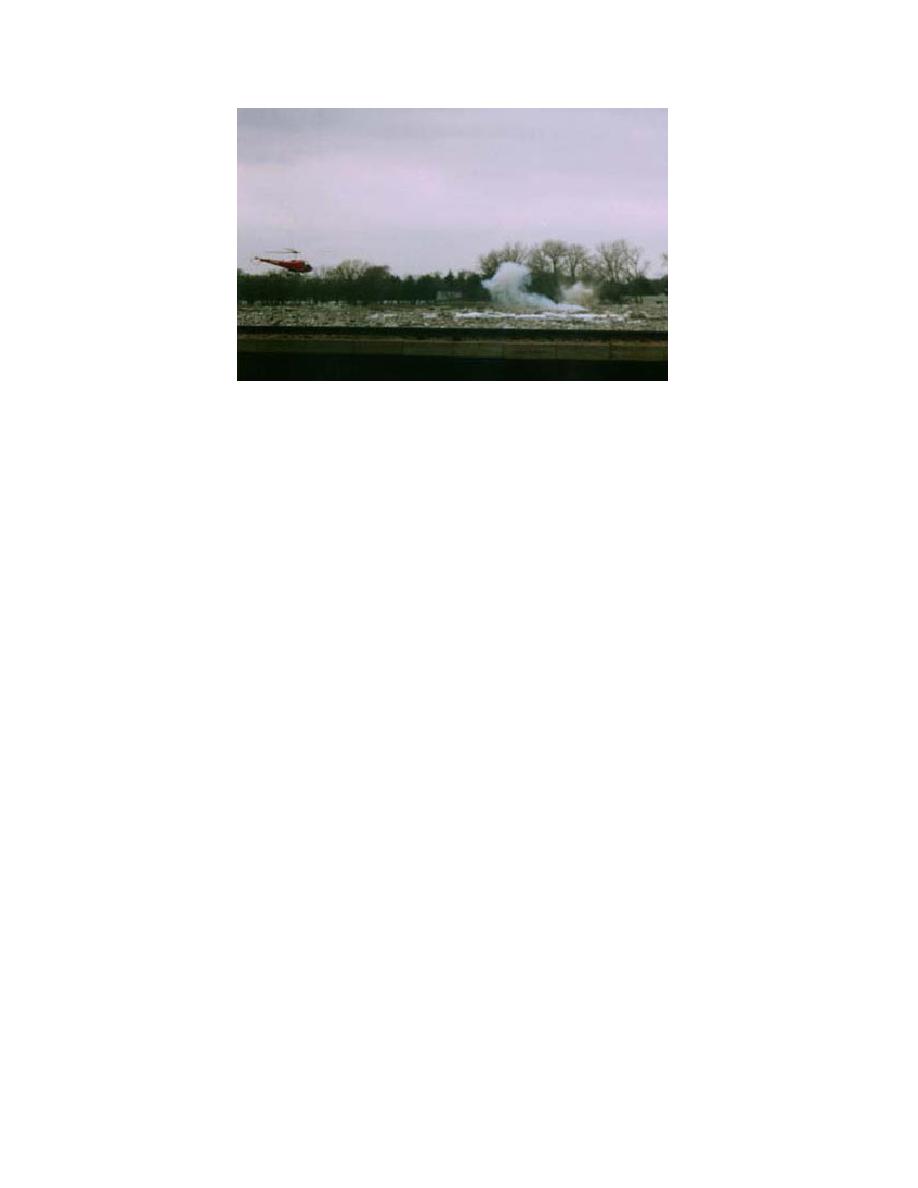
Figure 4. Blasting on the Platte River near Ashland in February 1997.
Following a devastating jam in 1993, state and Federal officials devel-
oped a rapid response plan that allows blasting to begin within hours.
(Photo courtesy of J. Mastandrea, Sarpy County, Nebraska, Emergency
Management Agency.)
to make predications about ice jam occurrences.
were rented to release the jam. A channel was
In an article in The Northern Engineer, Fountain
made about 1/2 mile long in 9 hours. They
(1984) notes that much remains to be done in the
planned to continue breaking the jam to a couple
effort of predicting ice jam floods and that an
hundred feet below the upstream end of the jam.
examination of river ice breakup statistics would
The rest of the jam was to be blasted. A tempo-
aid in the process. White (in prep.) has developed
rary dike was being put in place to prevent fur-
an ice jam progression model for the Yukon River,
ther flooding. The dike was an extension to the
based on ice event information contained in the
berm that was put in place during an event in
database (Fig. 5).
1980." (Figure 1 depicts typical damage during
CRREL plans to prepare summaries for all
this event.) This type of information will be use-
states and has completed brief summaries for
ful for future events at this and other sites, and
New Hampshire and Vermont (White 1995),
will also allow searchers to contact the local offi-
Alaska (Eames and White 1997), and Montana
cials to obtain first-hand information on the suc-
(Eames et al. 1998) to date. Following is the sum-
cess or failure of mitigation measures.
mary of ice jam data in Alaska, based on informa-
tion contained in the CRREL Ice Jam Database.
USING THE ICE JAM DATABASE
TO DEVELOP A THUMBNAIL SKETCH
Example: Ice jams in Alaska
OF ICE JAMS BY STATE
Ice jams occur frequently in Alaska, a state con-
taining 3000 rivers and located in the subarctic and
Review of ice jam summaries by state
arctic regions of the North America (Herb 1993).
The Ice Jam Database provides quick access to
In this sparsely populated state of 587,766 people
general information about specific ice jam events
(as of the 1992 census), ice jams can form and flood
in a particular state. These historical data are cru-
large areas without endangering any people or
cial during emergency situations where informa-
towns. However, many Alaskans depend on riv-
tion about jam locations or stages would be help-
ers as a source of food and transportation (Foun-
ful. Historical information is also important for
tain 1984), and as a result many towns are situated
studies at specific sites. For example, Alaskan
on river banks, thus being at risk for ice jam flood-
database entries were used by CRREL during the
ing. As of December 1996, 747 Alaskan ice jam
Kuskokwim River Navigation Reconnaissance
events were documented in the CRREL Ice Jam
Study, which evaluated the feasibility of naviga-
Database (Fig. 6).
tion on the river. Hydrological data are also used
7


 Previous Page
