winter. In 1964, for example, there were 13
reported breakup events in late January
after a rainstorm associated with rising air
temperatures. Thirty more breakup events,
many with significant damage and some on
the same rivers experiencing breakup jam-
ming in January, occurred in early March
1964.
Identification of ice event damage is
clearly the most difficult task in the contin-
ued expansion of the database, and yet
damage done is one of the most important
pieces of information for the end user. For
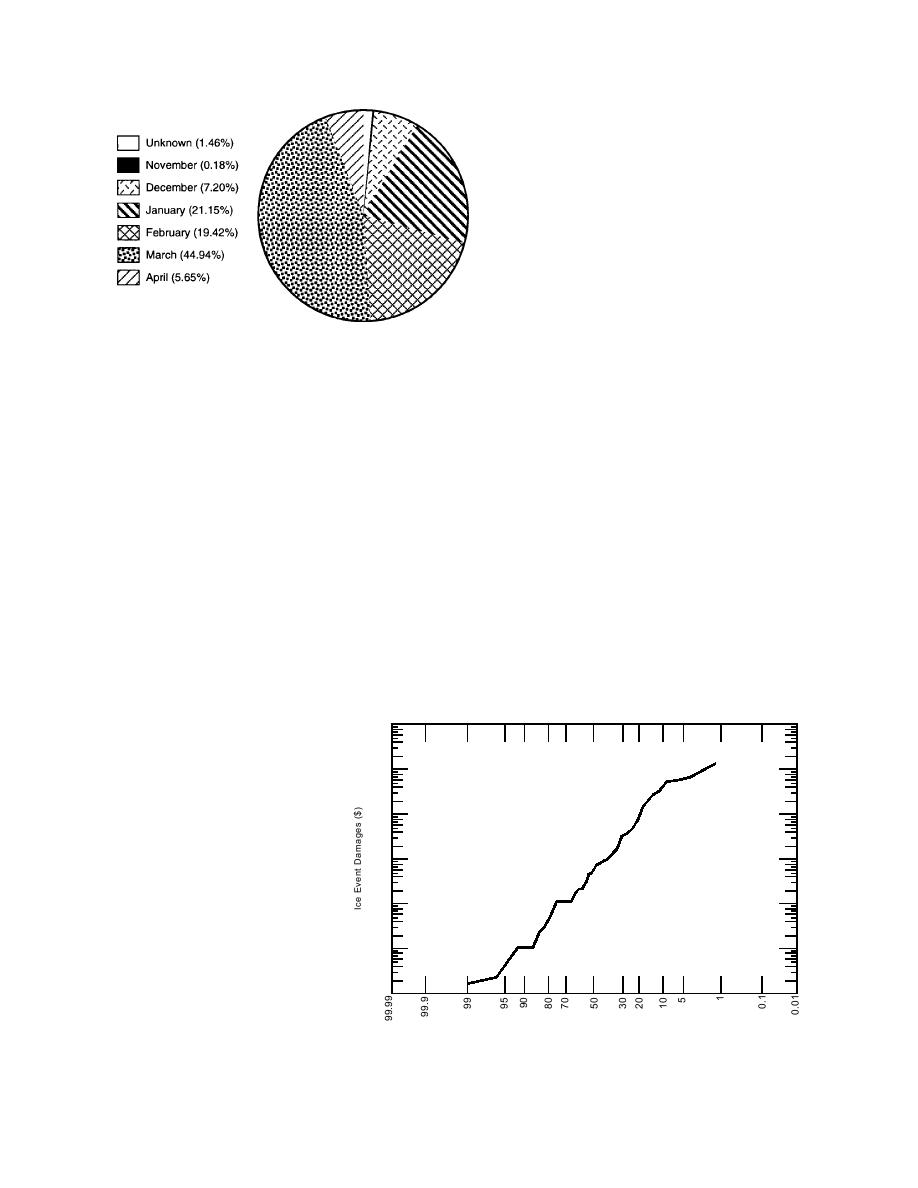
Figure 13. Monthly distribution of ice events in New
the United States as a whole, 22 ice-event
Hampshire and Vermont (from White 1995).
related deaths are reported in the database.
Two of these were in Vermont: one in 1867, the
that time, so less information is available from
other in 1936. In New Hampshire, 7 deaths oc-
the primary data source and the reliance on
curred along the Merrimack River during the
other, less readily available data sources is
March 1936 ice event that preceded the very large
higher.
open water flood of March 1936, and one in
It would be a mistake, however, to assume that
Claremont in 1981. Ice-related damage, including
all of the trends apparent in this figure are sim-
agricultural, residential, and commercial flood-
ply attributable to bias. For instance, both news-
ing, road closures, mitigation costs, and bridge
paper records and USGS sources confirm that
failure, was reported for 186 (17% of total) ice
there were relatively few ice events in New
events. The 37 New Hampshire and Vermont ice
Hampshire and Vermont during the early 1940s
events with damage estimates in dollars (3.4%)
and early 1950s, while they were frequent in the
are all ice jams that involved flooding. A very
late 1960s through the 1970s. These trends may
rough probability distribution for these 37 jams
prove to be related to long-term meteorological
shows that about nine of every ten exceed 00
cycles, or they may reflect population growth and
in damage, half of the ice jams exceeded ,000,
development patterns that affect perception
and that when ice-jam related damages occur,
stages. Both are subject areas that would benefit
costs can be expected to exceed
||content||
million 20% of
from further research.
the time (Fig. 14).
The database entries show
10 8
that ice events can happen at any
time during the winter in New
Hampshire and Vermont, but are
10 7
most frequent in March (Fig. 13).
Of New Hampshire ice events,
10 6
78% are not specifically classified
by type (e.g., freezeup, breakup,
combination) and 72% are un-
10 5
classified in Vermont. One dam-
aging ice event in New Hamp-
10 4
s h i r e was attributed to the
thermal expansion forces gen-
erated in a lake ice cover. Virtu-
10 3
ally all ice events that are type-
classified are positively identified
10 2
as breakup events. Breakup ice
events were reported as early as
Exceedance Probabilty
6 December and as late as 7 April,
and there have been multiple Figure 14. Damage-frequency curve for 37 reported ice-related damages in
breakup events during a single New Hampshire and Vermont in 1995 dollars (from White 1995).
13


 Previous Page
