A substantial amount of infor-
Other (14.3%)
mation on ice jams in Alaska was
collected during an examination
Chena River (2.1%)
Yukon River (33.2%)
of files of the National Weather
Buckland River (2.3%)
Service in Anchorage, Alaska, and
Koyukuk River (3.2%)
as a result 74% of the source pub-
lications are from the NWS. Other
Susitna River (3.9%)
sources of information are the
USGS, the U.S. Army Engineer
Tanana River (4.6%)
District, Alaska, CRREL, and
newspapers (17%). A series of
Kobuk River (6.6%)
CRREL Special Reports on ice
observations in the North Ameri-
can arctic and subarctic (Bilello
Kuskokwim River (29.8%)
1961, 1964; Bilello and Bates 1966,
1969, 1971, 1972, 1975, 1991; Bilello
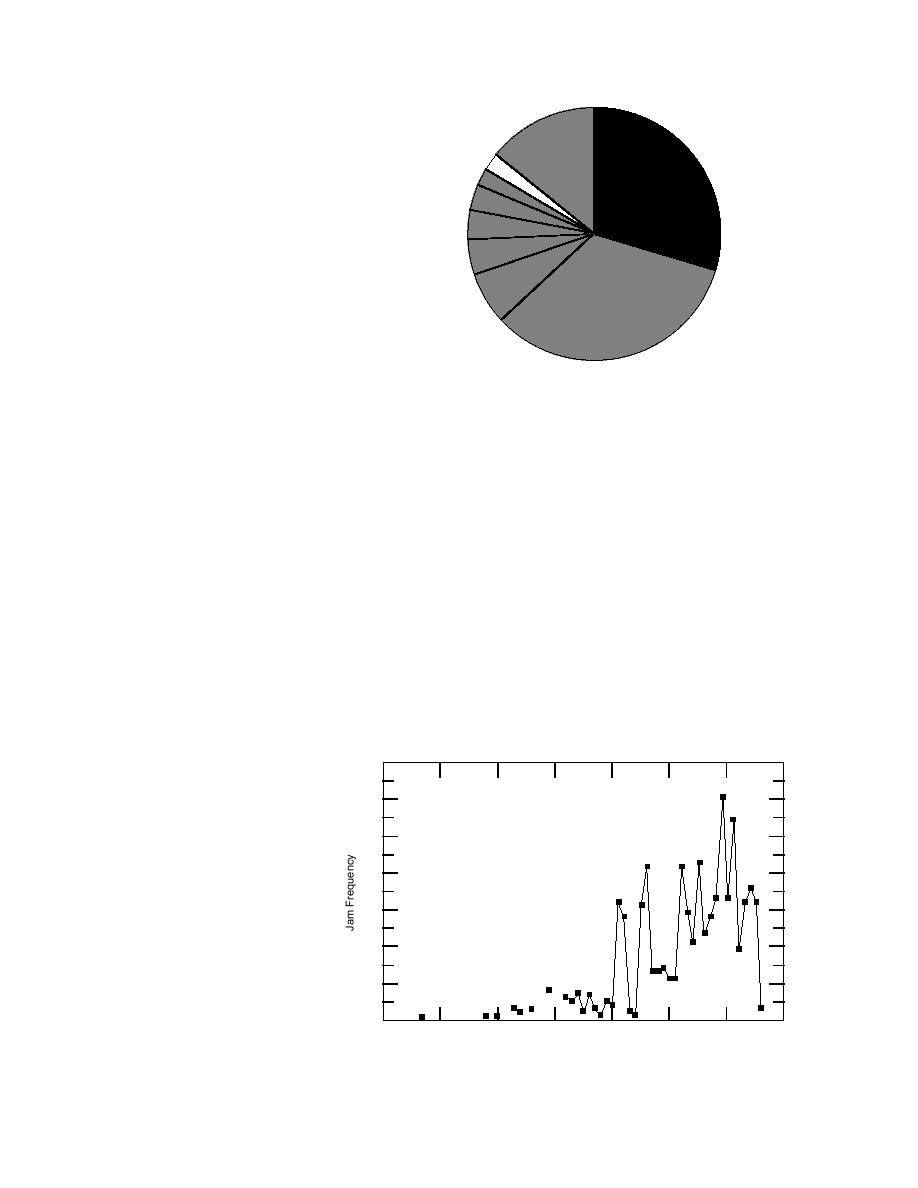
Figure 7. Distribution of jams in Alaska by river.
and Lunardini 1996) provided
about 4% of the ice jam informa-
tion. The Alaska Division of Emergency Services
in Alaska are recorded in the database (Fig. 8).
(ADES) was the source of about 5% of the infor-
From 1970 to the present, there are significantly
mation.
more ice events reported because this is the period
The database has information on ice jam events
for which records were readily available at the
on 60 different rivers in Alaska at 149 different
NWS. The limited ice jam data before 1970 is
locations. However, only nine have a population
partly attributable to the lack of USGS gaging sta-
greater than 1000 (1995 census data), 82 of the
tions before the late 1940s and early 1950s (Lamke
towns in the database had less than 1000 people
1989). In addition, while Alaska was purchased in
in 1995, and 54 of the locations in the database are
1867, it was not admitted to the union until 3 Janu-
described as not populated. Of the Alaskan entries
ary 1959, which may have hampered record keep-
in the database, 85.7% describe jams on the Yukon,
ing (Herb 1993). Ice jam frequency varies, with the
Kuskokwim, Kobuk, Tanana, Susitna, Koyukuk,
highest number of ice jams (61) recorded in 1989.
Buckland, and Chena rivers (Fig. 7). The Yukon
In 1991 there were 55 ice jams recorded. The num-
River has the most reported ice jams (248), fol-
ber of ice jams reported in the database in certain
lowed by the Kuskokwim River with 222 events.
years largely depends on the jam location and
The town of Bethel on the Kuskokwim River has
availability of jam records. For example, in 1991,
the greatest number of ice jam records for one
one of the more populated areas, Fairbanks,
location--26. It is important to
note that the perception bias is
70
p a r t i c u l a r l y important in a
s p a r s e l y settled state like
60
Alaska. The high frequency of
ice jam events on the Kusko-
50
kwim and Yukon rivers is in
part attributable to these being
40
the two longest rivers in
Alaska. More information is
30
available for these rivers than
for shorter, less-populated riv-
20
ers. Jams that happen away
from populated areas are not
10
likely to be recorded.
The earliest entry in the Ice
0
1930
1940
1950
1960
1970
1980
1990
2000
Jam Database for Alaska is a 1937
Water Year
event in Fairbanks. Between
Figure 8. Number of ice events recorded annually for Alaska.
1937 and 1970, only 56 ice jams
9


 Previous Page
