Damage in just ten of Montana's counties totaled
USING THE ICE JAM DATABASE
||content||
.8 million (Jones and Mclaughline 1996). On 7
TO CHARACTERIZE
February 1996, Governor Marc Racicot declared
ICE JAM EVENTS BY YEAR
Montana a disaster area because of ice jam flood-
ing in 21 of the state's 56 counties (Gallagher 1996).
Overview
In addition to a series describing ice events
January and February saw the greatest num-
throughout a state or region, CRREL has also ini-
ber of ice jams in 1996 (87%). During January 1996,
tiated an annual report of ice jams, beginning with
the most ice jams were reported on the nineteenth
1996. An example of an annual summary of ice
(25.6%) and during February the most ice jams
event data in the CRREL Ice Jam Database for
were reported on the ninth (Fig. 16). Weather pat-
water year 1996 (the period 1 October 1995
terns during January created favorable conditions
through 30 September 1996) is presented here
for ice jams; record early January snowfalls in the
(Eames 1997).
Northeast resulted in more than 20 in. (51 cm) of
precipitation. Widespread flooding resulted as
snowpacks melted because of warm weather and
Example of annual jams:
heavy rain between 18 and 20 January, creating
Water year 1996
The CRREL Ice Jam Database contains 272
rapid runoff leading to ice cover breakup and ice
entries in the database for water year 1996, the
jams.
highest number of annual ice jams recorded since
A major contribution to the formation of ice
1960, a year with 326 ice events. A substantial
jams in the Northwest was the above average
amount of the information on ice jams in 1996
snowfall. At the Stevensville Ranger Station
originated from the National Weather Service. In
(Montana), over 25 in. (64 cm) of snow was mea-
1996, 54.8% have some reported damages, includ-
sured in January, with 20.5 in. (52 cm) between 19
ing flooding and other damages to homes, roads,
and 29 January (Breeding 1996). In most major
and buildings. Only 3.3% of the entries for 1996
river drainages in western Montana, mountain
provide dollar amounts for damages.
snowpack levels were above the 30-year average;
Ice jams during water year 1996 affected 25
the Bitterroot drainage area reported 21% more
states, with Montana, New York, Vermont, and
snow than the 30-year norm and 35% more than
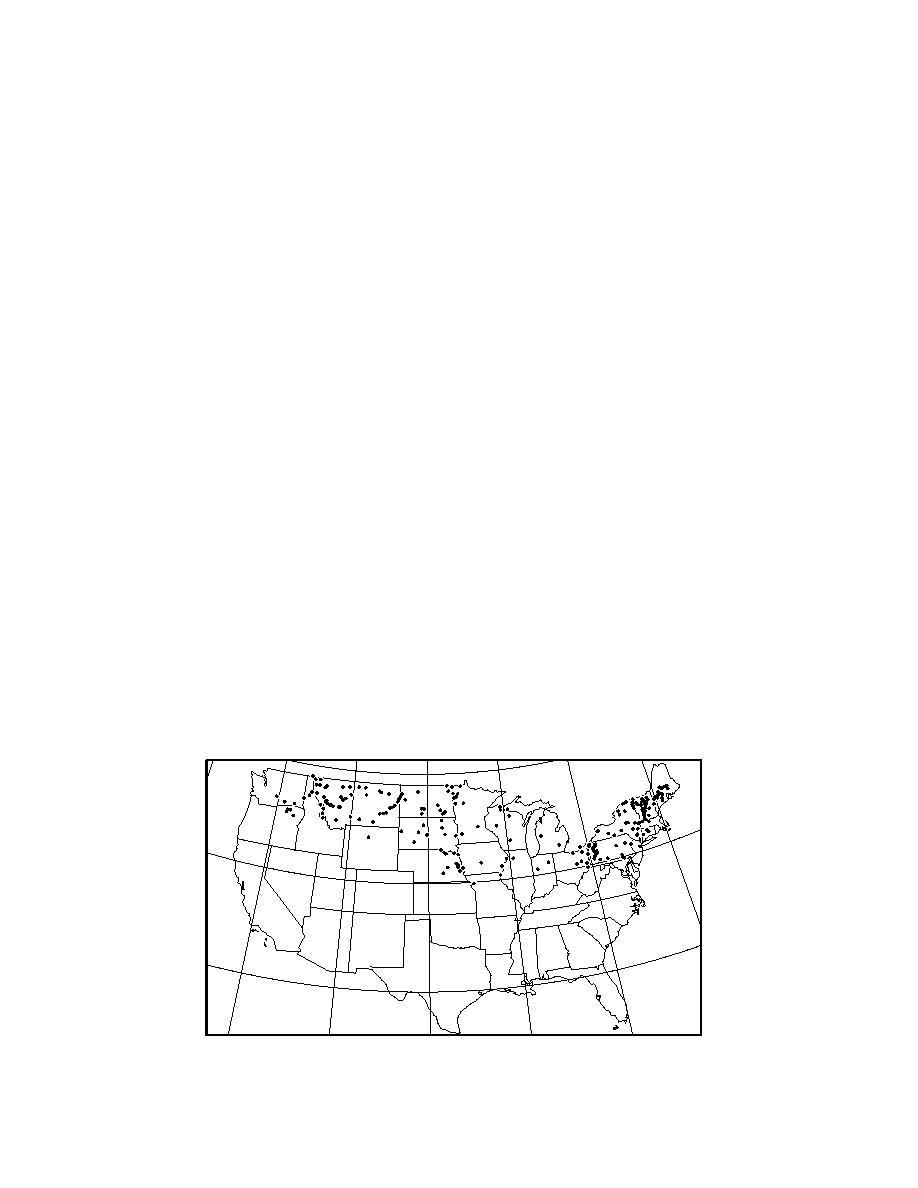
Pennsylvania most affected (Fig. 15). The rivers
the previous year (Missoulian 1996). Following the
with the most reported ice events were the Mis-
snowfall, there were subzero temperatures as low
as 33F (36C), which formed thick ice covers.
souri, Connecticut, Yellowstone, and Allegheny.
Montana experienced the most extensive damage
A February warm spell that kept temperatures
ascribable to ice jams during water year 1996.
well above freezing for a week resulted in rapid
130
120
110
100
90
80
70
40
40
30
30
120
110
100
90
80
Figure 15. Locations of reported ice events in water year 1996 (from Eames 1997).
14


 Previous Page
