

Figure 10. Moose trapped on an ice floe during breakup, Yukon River.
1,400,000
1,200,000
1,000,000
800,000
600,000
400,000
200,000
0
99.9
99
95 90 80 70 50 30 20 10 5
1
0.1
Percent of Time Equaled or Exceeded
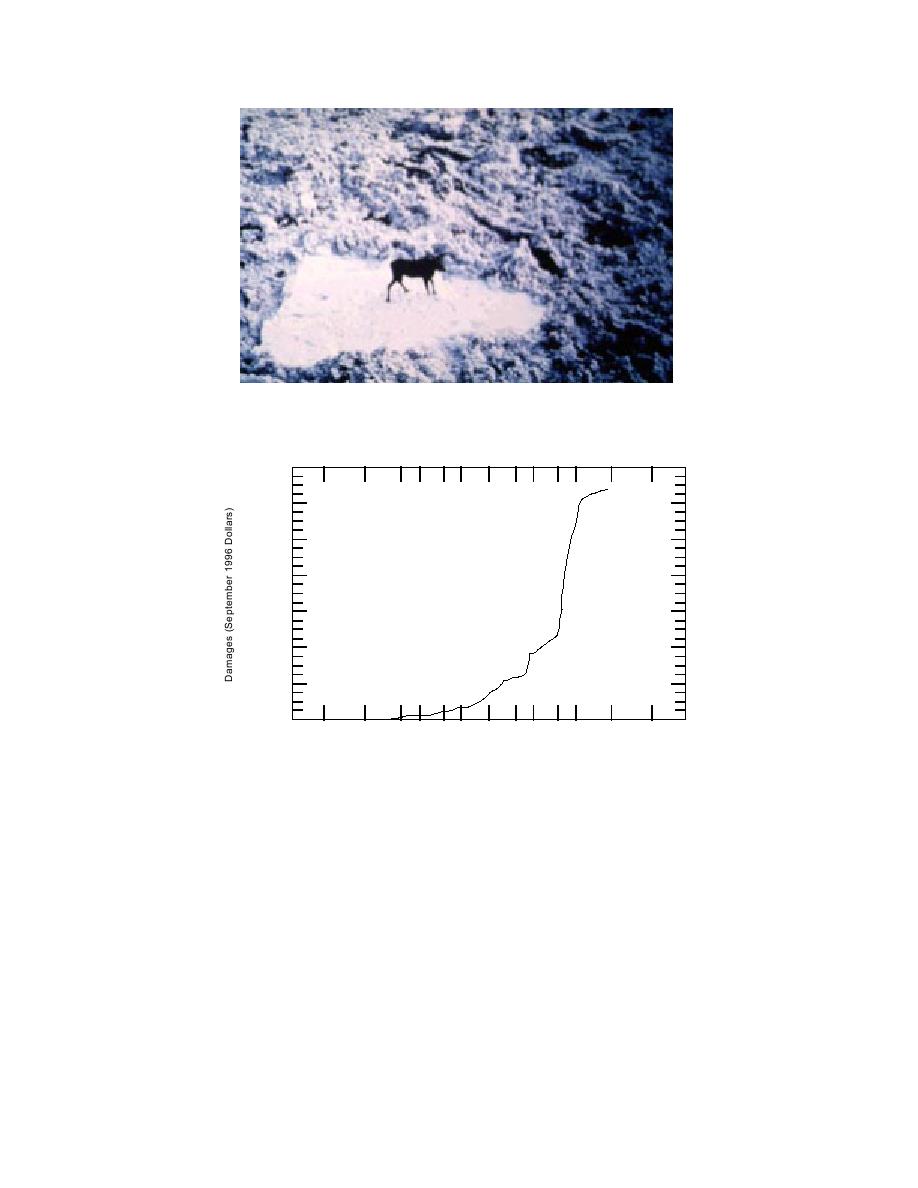
Figure 11. Damage-frequency curve for reported ice-related damages in Alaska
between 1982 and 1994 in September 1996 dollars (from Eames and White
1997).
towns of Akiak and Napakiak on the Kuskokwim
USING THE ICE JAM DATABASE
River, and the towns of Galena and Sheldon
TO CHARACTERIZE ICE JAM
Point on the Yukon River, totaled about mil-
EVENTS IN A REGION
lion (September 1996 dollars). More recently, in
1994, an ice jam on the Yukon River in the town
Overview
of Galena caused 0,000 in damage (September
Characterizing ice jams on a regional basis pro-
1996 dollars). These damages can be presented in
vides some of the same information as the
the form of a damage-frequency curve (Fig. 11),
example for a single state above. Summaries can
which shows reported damages for the period
be prepared for groups of states (e.g., New
1982 through 1994 in 1996 dollars. The figure
England), and for river basins or other areas whose
indicates that during the 13-year period, damages
boundaries can be described by hydrologic unit
exceeded 0,000 about half the time.
areas. For example, ice events in the Susquehanna
11

 Previous Page
