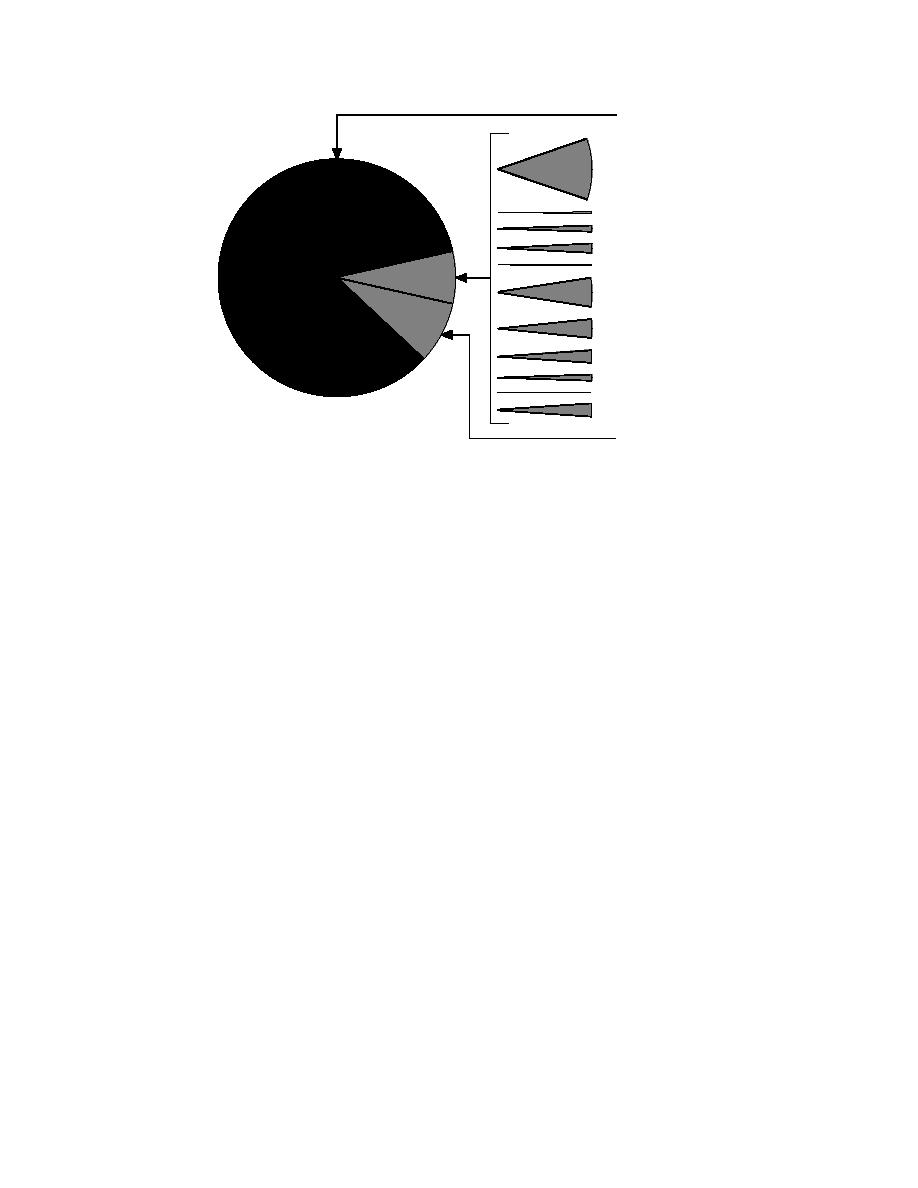
May (84.6%)
June (2.7%)
July (0.1%)
August (0.3%)
Unknown (0.4%)
September (0.1%)
October (1.3%)
November (0.8%)
December (0.5%)
January (0.3%)
February (0%)
March (0.5%)
April (8.3%)
Figure 9. Monthly distribution of ice events in Alaska.
experienced extensive ice jam flooding. As a result,
Ice jams can also have damaging effects on
news stories and other publications emphasized
wildlife (Fig. 10) and the natural environment, as
ice jam occurrences everywhere in Alaska more
well as humans and their associated structures.
than usual that year.
For example, in 1989, an ice jam on the Nowitna
Ice jam occurrence also depends on the season.
River created a lake hundreds of square miles
Of the 747 ice jam events in the Alaskan database,
in area, and high water marks 40 miles (64 km)
663 took place in May, which is typically when the
upstream were 9 ft (3 m) above the riverbank
rivers begin to break up (Fig. 9). From these data,
(Hunt 1991). A fly-over of the flooded area found
we can conclude that Alaskan ice jams are largely
nine moose trapped on a small knoll (Hunt 1991).
breakup ice events. Freezeup events do occur,
The effects of such a catastrophic event on the
though less frequently.
environment are unknown. In general, ice-related
For many Alaskans, the breakup of river ice
losses of fish, wildlife, and riverine habitat, and
means the end of frozen highways and the start
their effects on local economies, are not well docu-
of open water transportation (Fountain 1984).
mented in Alaska.
Most people who live along rivers expect flood-
As is the case for the database as a whole,
ing during the time of breakup, and simply move
many of the sources of information on ice jams in
to higher ground (Hunt 1991). In Emmonak on the
Alaska lack specific data on damages. However,
Yukon River, flooding is a way of life. All homes
damages have recently been reported by the
are on pilings and during high water the power
Alaska Division of Emergency Services Prelimi-
plant is shut down and people visit each other in
nary Damage Assessment Team, with the result
skiffs (Hunt 1991). Says the City Manager, "No-
that 146 of the reported Alaskan ice events (19.5%)
body really gets excited. Everything is put away
have known damages, a much higher percentage
and everything raised up, and we deal with it"
than the whole database (about 2%). The most
(Hunt 1991). However, ice jams can take towns by
common damages reported are lowland flooding,
surprise with rapid flooding and extensive dam-
bank erosion, flooded homes, and road damage,
age caused by ice floes that are carried out of the
such as a 1989 ice jam flood in Alakanuk on the
river banks. In 1971, a very rapid rise in water
Yukon River, in which ice took two homes off of
level at Alakanuk damaged every structure in the
their pilings (Hunt 1991). Some ice jam floods can
village and residents were forced to await rescue
cause extensive damage and be quite costly for
from rooftops and boats (Newsminer 1971).
communities. In 1971, ice jam damage in the
10


 Previous Page
