60
19 Jan 1996
50
40
30
20
9 Feb 1996
10
0
31 Oct
23 Nov
16 Dec
9 Jan
1 Feb
24 Feb
18 Mar
10 Apr
3 May
1995
1995
1995
1996
1996
1996
1996
1996
1996
Jam Dates
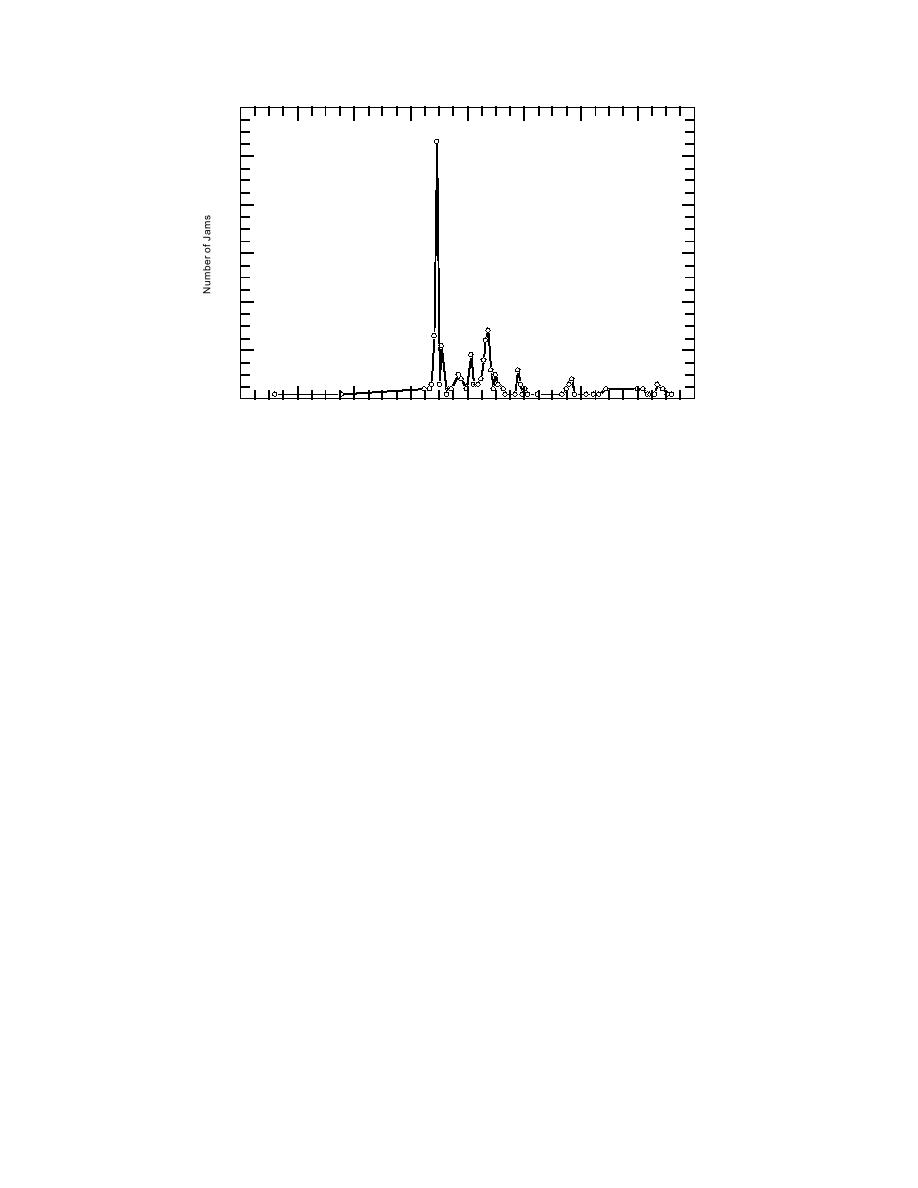
Figure 16. Number of reported ice events in January and February 1996. January
events were primarily located in the Northeast, while February events were prima-
rily located in the Northwest (from Eames 1997).
breakup of river ice covers and the formation of
project (Safe Harbor Power Corp. 1996). Down-
jams (Breeding 1996).
stream from the Safe Harbor Dam, the Cono-
Weather conditions were similar in the New
wingo Dam was next to be affected by the wave
York and Pennsylvania portions of the Susque-
of water and eventually the City of Port Deposit,
hanna River Basin. Snowstorms in early January
Maryland. Port Deposit experienced severe flood-
dumped about 23 in. (58 cm) above normal
ing and was reported to only have had 1/2 hour
snowfall throughout the 27,000-mile2 (70,000-
of warning time.
km2) Susquehanna River Basin, with a water
The CRREL Ice Jam Database reports over
equivalent of 3 to 4 in. (810 cm) (Kelley 1996).
million of ice-related damage in New York for
Massive runoff began 18 and 19 January, when
1996. According to contemporary Corps Emer-
strong winds and dew points reaching into the 50s
gency Operations Situation Reports (SITREPS),
(10s in degrees Celsius) melted the snowpack cov-
preliminary damage figures for the ice-jam-
ering the entire Mid-Atlantic region. Conditions
affected counties of Lewis, Jefferson, St. Lawrence,
were exacerbated when a cold front moved in
and Erie totaled over
||content||
.1 million, with more than
on 19 and 20 January, along with rainfall, with
350 homes affected.
the result that Pennsylvania experienced the
Vermont reported 27 ice events in the Ice Jam
most severe statewide flooding since tropical
Database for 1996. The high frequency of ice jams
storm Agnes in June 1972 (USGS 1996). In approx-
in Vermont during 1996 was influenced by above
imately 50 locations throughout the state, the
average snowfall followed by heavy rains and
magnitude of floods was increased by ice jams
warm weather (Stahl 1996), with 74% of these
(USGS 1996). On the Susquehanna River at
jams occurring between 18 and 20 January. Dam-
Safe Harbor, the 75-year average flow was
ages on 19 January included the Route 12 bridge
38,300 ft3/s (1085 m3/s) (Kelley 1996). An ice jam
failure in Woodstock and extensive ice damage in
that broke at Turkey Point on 20 January sent
Middlesex that was caused by the failure of a jam
water and ice toward Safe Harbor, where flood
on the Winooski River upstream in Montpelier.
gates at the dam were opened to deal with the
An ice jam between Bellows Falls, Vermont, and
average daily discharge of 826,000 ft3/s (23,384
Charlestown, New Hampshire, on the Connecti-
m3/s). Damage to the Safe Harbor Dam was
cut River resulted in the closing of Routes 12 and
reported to be approximately million, and the
5 and the evacuation of 18 families on the same
ice jam caused million in damage to a mill
date.
15


 Previous Page
