1400
1200
1000
800
600
400
200
0
0
5
10
15
20
25
30
Day of Event (day 0 = first report ice jam)
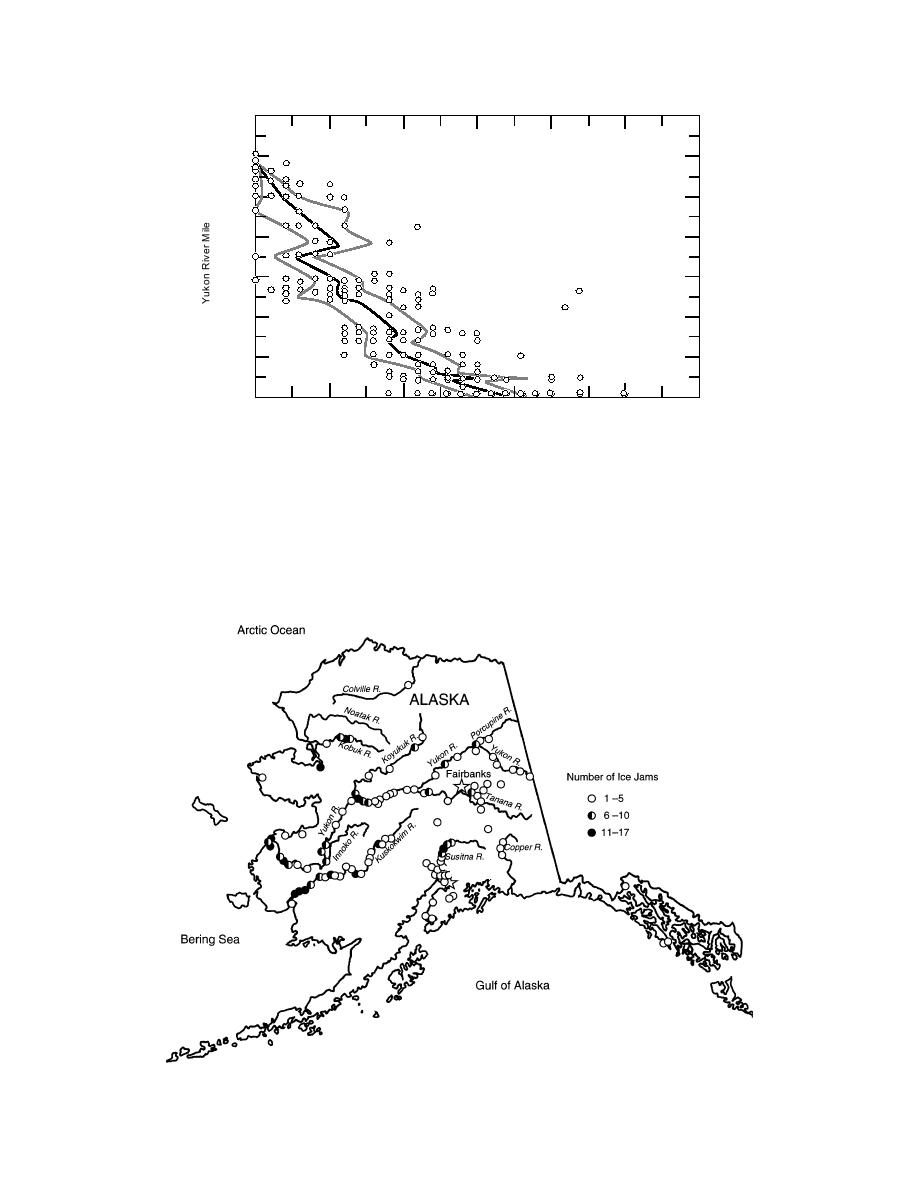
Figure 5. Proposed near-term ice jam occurrence model on the Yukon River is based
on information taken from the CRREL Ice Jam Database. Presented here is the
expected ice jam occurrence, shown along with the 95% confidence interval on which
forecasts are based (after White, in prep.).
Anchorage
Figure 6. Locations of reported ice events in Alaska.
8


 Previous Page
