500
400
300
200
100
0
1900
1920
1940
1960
1980
2000
Water Year
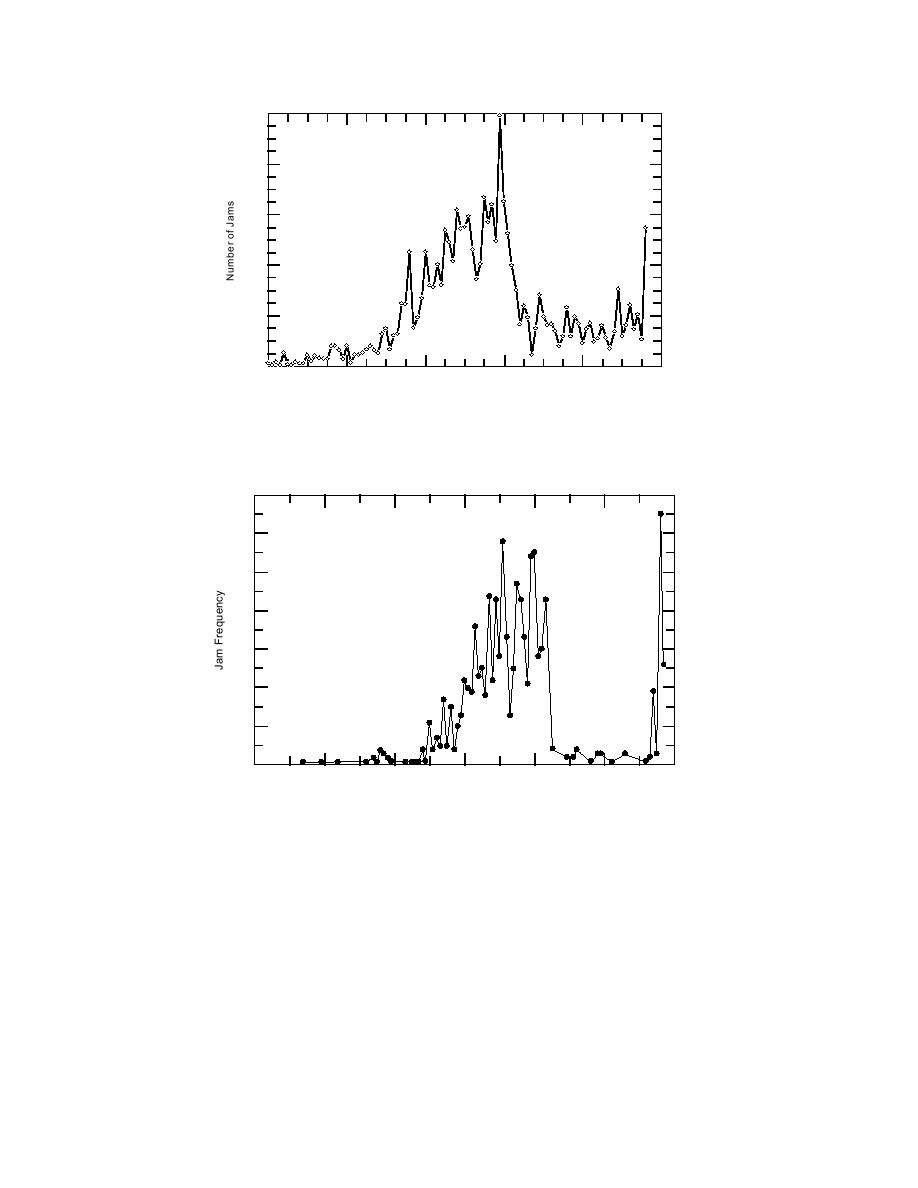
Figure 2. Annual number of ice events recorded in the CRREL Ice Jam
Database since 1900.
70
60
50
40
30
20
10
0
1880
1900
1920
1940
1960
1980
2000
Ice Events Reported in Montana, 1894-1997
Figure 3. Annual number of ice events recorded between 1894 and 1997 in
Montana (after Eames et al. 1998). Data are lacking for the period 1965 to 1995.
that were damaged in the extreme open-water
assume that the unusual temporal variation in ice
floods of March 1936. The dams had provided ice
events is a result of bias, but in this case, evidence
storage and impeded the breakup and movement
suggests that the database record is a good rep-
of the ice cover, limiting the formation of damag-
resentation of what actually took place. A care-
ing ice jams. After all the dams were gone, sig-
ful review of flood records since 1870 (USACE
nificant ice jams occurred with much greater
1973) indicated that there was only one docu-
frequency. Following the ice-related flood of
mented ice jam flood in Lancaster prior to 1950
record in March 1968, the Corps of Engineers and
(in 1895). The marked change in ice event fre-
CRREL became involved in a series of studies
quency at this site after 1950 may be attributed to
that resulted in the construction of an experimen-
the failure by then of four mill dams in Lancaster
4


 Previous Page
