in the same manner as the larger, more steeply
400
A
sided basins with greater snow cover, described
a. 20 Jan 94
60 cm Snow
by Nakamura and Magono (1982), Magono et al.
(1982), Maki et al. (1986), and Maki and Harimaya
(1988). This is consistent with the theories that
early formation of inversion and diminished ex-
300
change of tropospheric heat from greater eleva-
tions result in diminished temperatures in
snow-covered basins. The similarity of isotherm
( 38.8)
W
intersections at Clay Hollow in Figure 17 is in-
dicative that the same mechanism causes the fre-
200
quently diminished air temperatures observed
there.
P
SOME EXTREME TEMPERATURES
100
A
400
OBSERVED COINCIDENT WITH
16
UNIFORM SNOW COVER
b. 21 Jan 94
60 cm Snow
It may be significant that the largest and low-
est basin in the study area, along the Connecticut
300
River, rarely attains the coldest local morning air
temperature under snow cover of less than 20 cm.
The temperature differences observed in repli-
cate measurements under inversion conditions in
( 34.0)
W
Part I may reflect exchange of warmer air from
200
aloft to the layer within 10 m of the surface, as
proposed by Magono et al. (1982). Snow cover of
greater than 20 cm is accompanied by more fre-
quent occurrences of the coldest air at P in the
P
river basin. Deeper snow cover may provide a
100
more Hokkaido-like, uniform snow surface in this
400 A
lower basin, promote inversion formation, limit
c. 27 Jan 94
exchange from aloft, and allow colder surface air
66 cm Snow
temperatures there.
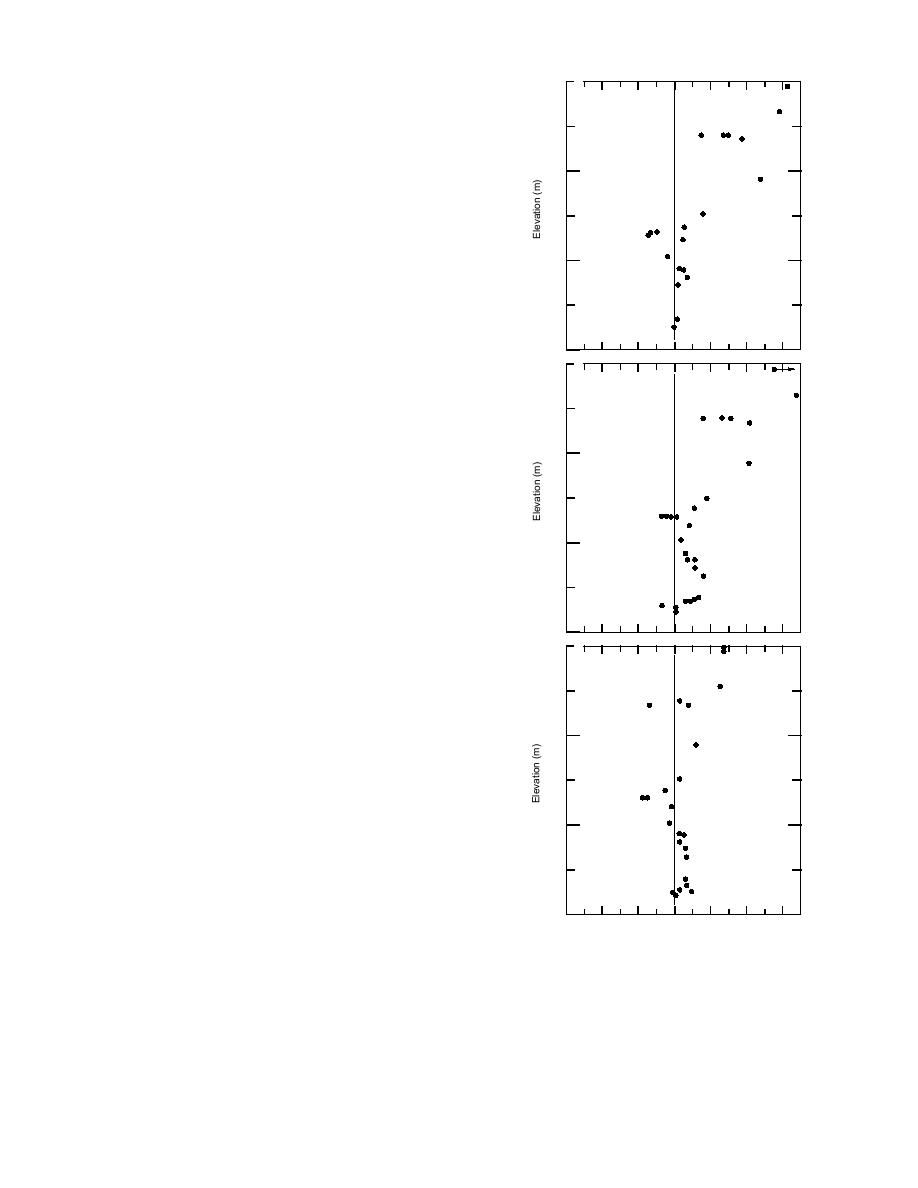
The vertical profiles in Figure 19 represent days
from the winter of 199394, which were quite
300
unusual. These observations are comparable to
the 199093 data set as the same instrumentation
and measurement protocols were used. The time
( 39.1)
period 2027 January 1994 contains the authors'
W
only verifiable observations of air
200
temperature less than 35C at
Figure 19. Temperatures
less than 45N latitude and lower
along the same observa-
than 1-km elevation in 30 years
tion path, observed with
of experience. The same tempera-
the same instrumentation,
P
ture difference scale is used in
during a very cold period
100
12
8
4
0
4
8
12
Figures 18 and 19 to allow com-
in 1994: a) An inversion
Temperature Difference (C)
parison.
is present from 125 to 220,
The ground was covered by
which strengthens above 230 m, on 20 January 1994 over 60 cm of snow.
60 cm of snow on 20 January 1994
b) Strong inversions above the river and in basins I and II 21 January over
(Fig. 19a) and strong cold advec-
60 cm of snow. c) An extremely cold day, 27 January 1994, with sus-
tion conveyed air of 33C at
pended ice crystals, 66 cm of snow, and inversions over the river, basins I
0700EST to Mt. Washington.
and II. Warm advection had begun at the time of this observation at Mt.
There was no temperature mea-
Washington.
23


 Previous Page
