21
19
1600
22
a. 2 Feb '94
24
25
27
28
26
1400
27
28
28
1200
27
26
26
27 (C temp.)
27
28
1000
27
29
28 28
27
28
30
29
800
z
W
24
1600
24
b. 10 Feb '94
24
23
23
24
23
24
1400
25
23
27
1200
27
29
28
30
28 (C temp.)
31
1000
32
32
28
30
31
30
33
34
31
33
800
0
2
4
6
8
10
12
Chord (km)
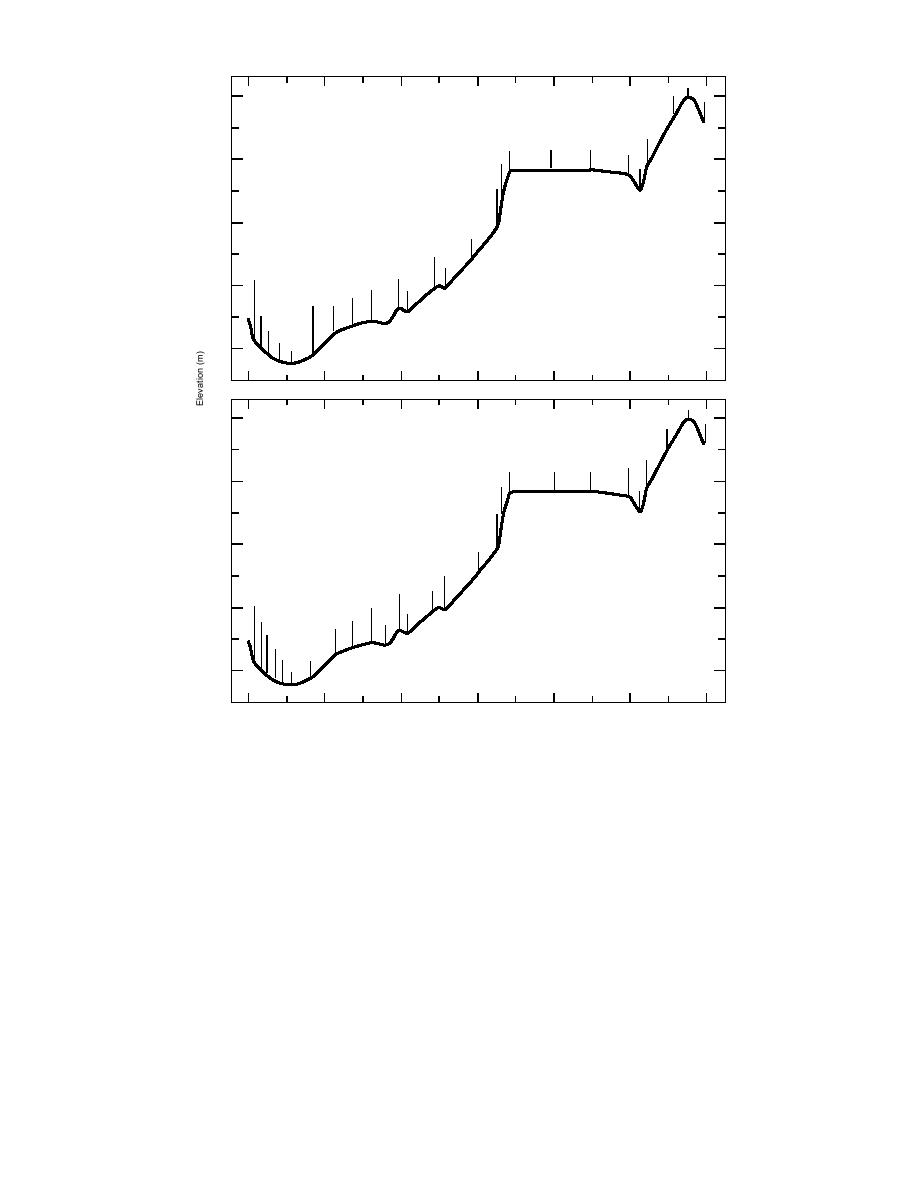
Figure 22. Temperature observed relative to the topographic cross section along the 045
radial from Z, to a more distant ridge of greater elevation than A. Temperatures along
other ridges were comparable to A, but other basins of similar size to basin II along
Eastman Brook had greater air temperatures.
in Part I. Temperatures were observed along sev-
at 230 m, decoupling the layers below from
eral paths from W to P, W to H, and H to P.
warmer air advected over the study area.
Temperatures observed over 10 cm of snow cover
The northsouth observation path PSL
on 13 February 1992 are presented in Figure 23, as
reaches an elevation of 220 m at S, and returns to
a function of elevation. The inversion which in-
river level at u, 29.4 km south of P. Vertical tem-
tersects the terrain slightly above basin II appears
perature profiles extracted from observations
to intersect terrain at several places of similar
along tSu on days with inversion along PWA
elevation north of the usual observation path.
are plotted in Figure 24. These vertical profiles of
While there are only a few mornings of explora-
temperature difference with respect to that at P
tion data available, these observations support
are stratified by snow cover class as in Figures 10
the more general observations that an inversion
and 11, but contain less days of observation. Lapse
above the Connecticut River intersects the terrain
or isothermal structure predominates when snow
26


 Previous Page
