350
350
Z
Z
300
300
II
250
250
4
a. 090 from Z
d. 315 from Z
200
200
350
350
Z
Z
300
300
II
250
250
W
V
b. 045 from Z
3
e. 270 from Z
200
200
0
0.4
0.8
1.2
1.6
350
Distance (km)
Z
300
II
V
5
250
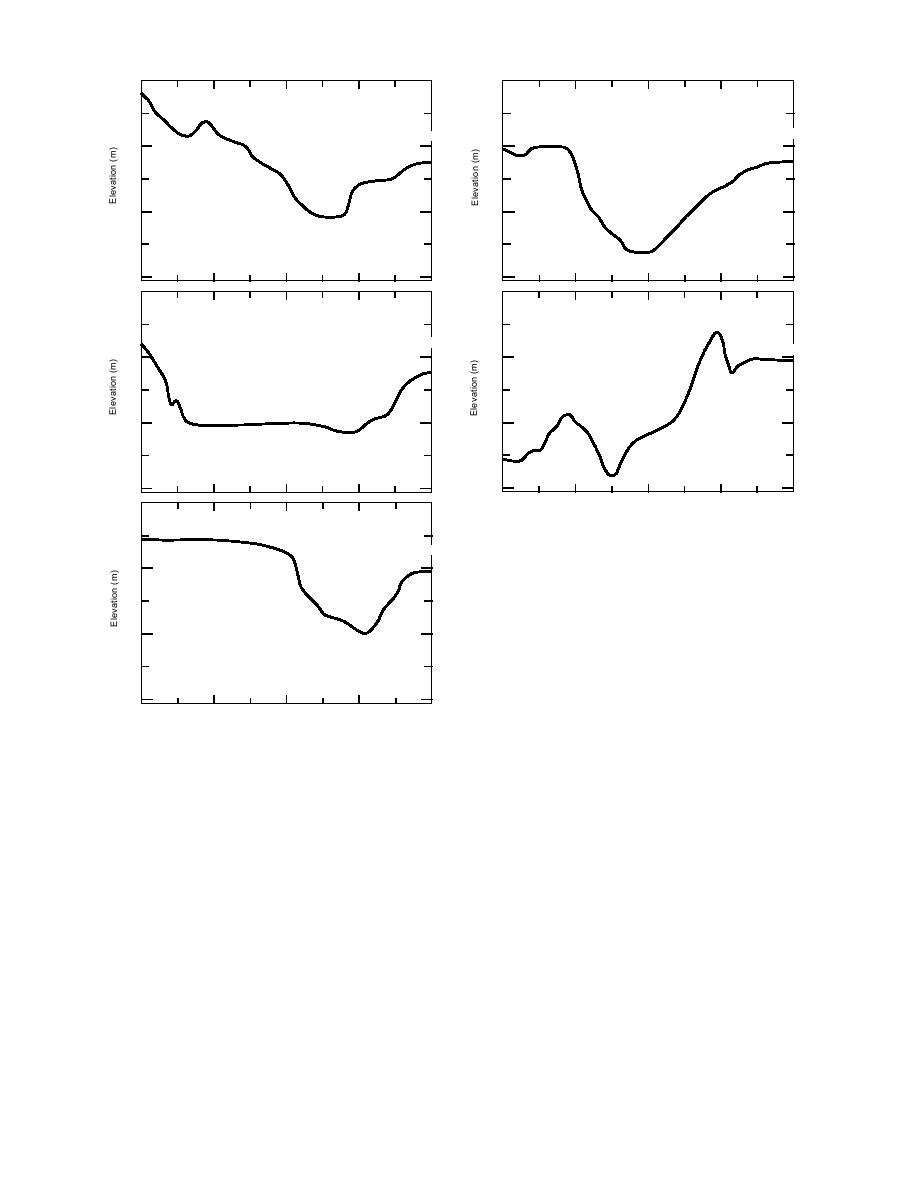
Figure 15. Topographic cross sections at 45 direction
intervals extending radially from Z. Landmarks and
observation points from Figure 9 are provided for ori-
c. 360 from Z
entation.
200
and Maki et al. (1986) was accomplished when 1.5
when continuous snow of >20 cm was present, or
m or more of snow covered the ground. Our ex-
at c in the small basin (I) at Clay Hollow at 340-m
perimental area has many slopes and basins, but
elevation. There were fewer than five singular
local relief is generally less than that of Hokkaido.
events where the coldest morning air tempera-
The Connecticut River Valley observations are at
ture was observed at another place. We thoroughly
lower elevation but similar latitude to the
examined, in Part I, the relation of air tempera-
Hokkaido observations, and include snow depths
ture at P to other places in the Connecticut River
of 0 to 0.75 m. The minimum temperatures ob-
Valley. A rigorous examination of the tempera-
served in the two locales were quite similar dur-
ture structure near W and c is necessary to assess
ing the experiment periods.
the processes which may diminish air tempera-
The data of Figures 10 through 14 indicate that,
ture at those places.
under inversion, the coldest mean morning air
Although Figure 9 is the largest scale map avail-
temperature and the greatest frequency of coldest
able, it does not clearly establish that W is a basin
morning air temperature in the area occurred in
that narrows to a small valley as one proceeds
the small basin (II) surrounding W in Figure 9.
downslope. Topographic cross sections extend-
ing radially from Z, in Figure 9, at 45 intervals
When the coldest air temperature did not occur at
W, it most frequently occurred at the bridge P
are shown in Figure 15. The upper entrance to the
19


 Previous Page
