a. 7 Feb 93
b. 2 Feb 93
22 cm Snow
22 cm Snow
Frost
400
A
A
I
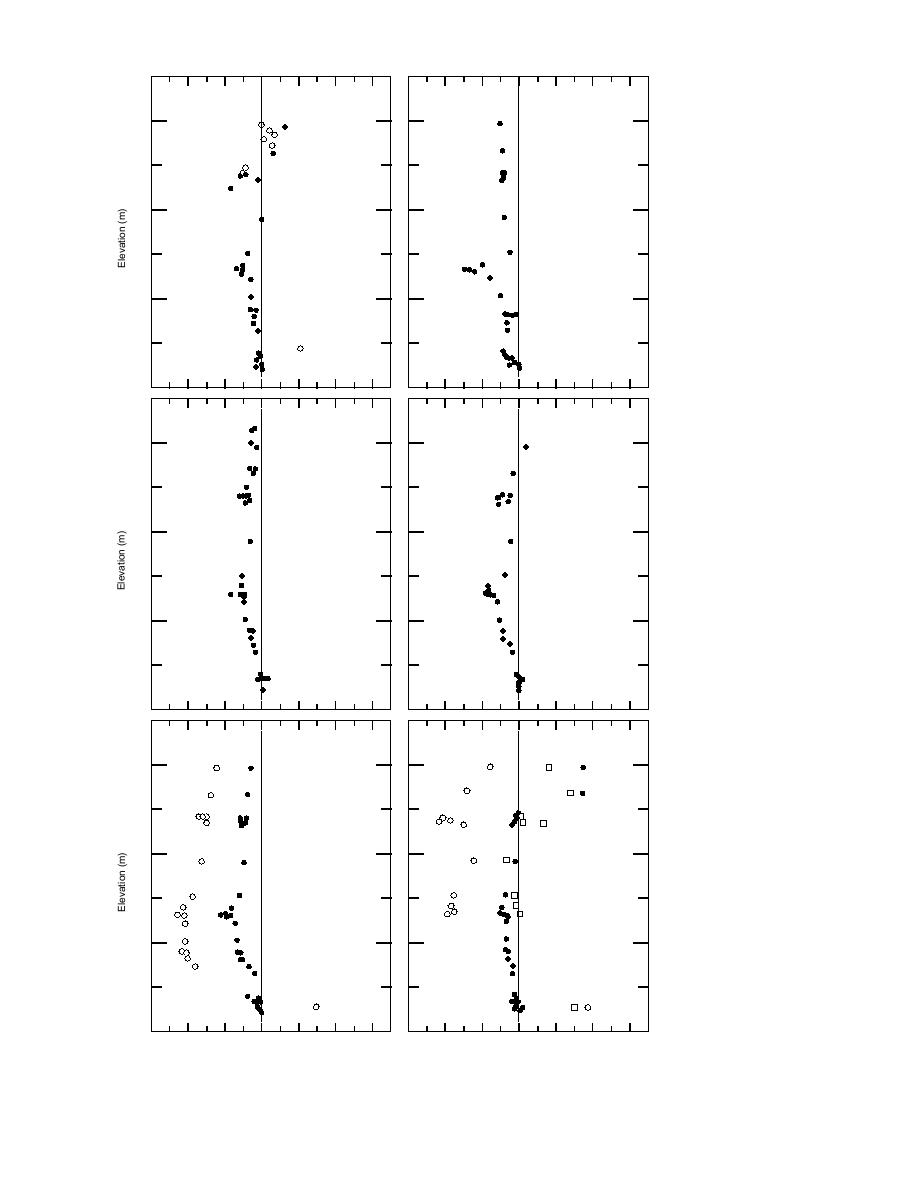
Figure 18. Vertical pro-
( 35.0)
files of 0700LCL air tem-
300
perature extracted from
s u r f a c e observations
along PWA: a) The
W
W
II
( 34.5)
( 24.8)
coldest day of the study
period, 7 February 1993,
200
III
following strong cold
advection throughout 6
IV
Change
P
P
February. The open cir-
cles indicate temperature
change since 2100 6 Feb-
100
ruary. b) Temperature
c. 1 Jan 91
d. 10 Dec 92
profile over 20 cm of
< 3 cm New Dusting
< 5 cm Snow
Large Frost Crystals
snow 2 February 1993,
A
400
A
following 24 hours of
strong cold advection. c)
The coldest snowless
day, 1 January 1991;
grass protruded through
300
a dusting of less than 3
cm of new snow. d) A
W
W
day with significant ra-
( 21.0)
( 19.8)
diational cooling, 10
December 1992; large
200
frost crystals formed on
<5 cm of snow. e) Fol-
P
P
lowing cold advection 22
January 1991; the open
100
circles indicate tempera-
ture change at that point
e. 22 Jan 91
f. 23 Jan 91
since 2100 21 January,
22 cm Snow
20 cm Snow
A
A
over 20 cm of snow. f)
400
During warm advection
23 January 1991; the
hollow squares indicate
t e m p e r a t u r e change
300
17002200 22 January,
the hollow circles indi-
cate temperature change
W
W
( 26.8)
2200 22 January to 0700
( 26.1)
23 January over 20 cm
200
of snow.
P
P
Change
Change
100
12
8
4
0
4
8
12
12
8
4
0
4
8
12
Temperature Difference (C)
22


 Previous Page
