cover is sparse. Inversion structure becomes more
frequent as snow cover deepens and becomes
Indian Pond Rd.
Eastman Brook (25C)
more continuous. The inversion based at the plane
400
Lily Pond Rd.
Oliverian Brook (25)
coincident with the river bank becomes prevalent
Haverhill (Rte. 10) and River Rd.
throughout the study area when thicker more
Piermont/Lyme (Rte. 10)
Lyme/Hanover (Rte. 10)
continuous snow cover is present.
We proposed, in the introduction to Part I, that
350
vertical temperature structure around the Con-
necticut River could be inferred from a field of
surface observations along terrain of varying el-
evation. The temperature difference at two eleva-
300
tions was used to stratify observation mornings
in apparent "lapse" and "inversion" categories,
and yielded time and space variation of surface
temperature consistent with those stability cat-
egories. We showed, in Figures 10 and 11, that the
250
temperatures over small basins, along slopes, and
in the basin along the Connecticut River re-
sponded consistently to the inferred lapse of in-
version structure. We then showed through
200
frequency analysis that the temperature inflec-
tions tending toward minima, of Figures 10 and
11, coincided with basins in topographic cross
section. We verified through analysis of individual
days of varying snow cover and synoptic condi-
13 Feb 92
150
10 cm Snow
tions that the temperature inflections over slopes
Dead Calm/Light Frost
and basins were persistent features, and that these
18 basins did indeed begin cooling earlier at night
28
26
24
22
20
Surface Temperature (C)
than surrounding terrain. These observations are
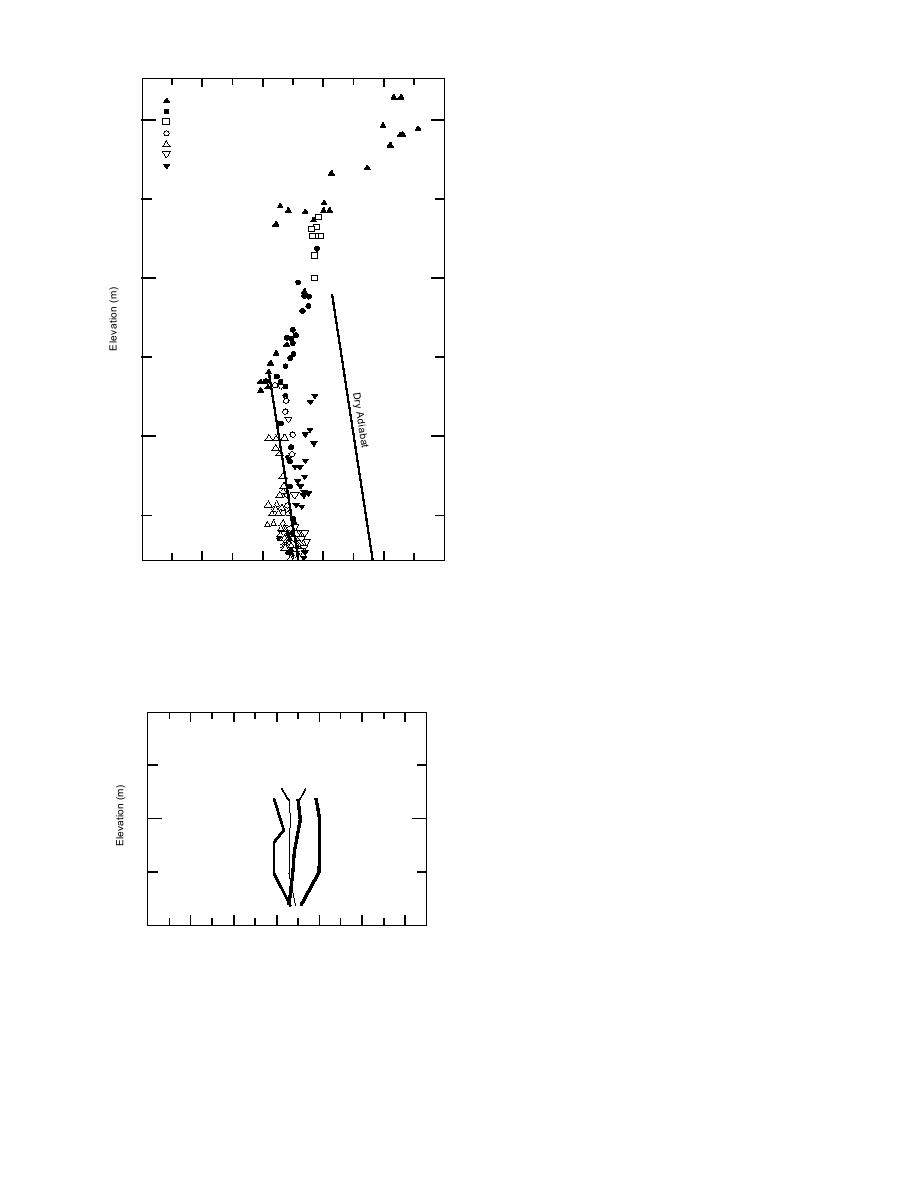
Figure 23. A composite plot of elevation and surface air all consistent with those of Magono et al. (1988)
temperature at that elevation observed along several paths and Nakamura and Magono (1982), who mea-
within 10 km of the usual observation path on 13 February sured similar winter temperature structure with
an array of fixed thermometers and tethersondes.
1992.
We have not measured the vertical tempera-
ture profile in the lower 300 m of air over the
Connecticut River on any observation day. All of
300
our results are consistent with our inference that
measurement of surface temperatures at two el-
evations sufficiently defines lapse or inversion
3-10 cm 10-20 cm
for analytical purpose, and our analyses agree
with those from Hokkaido. We propose that this
200
moving probe method of temperature analysis
was as successful in the Connecticut River Valley
<3 cm
>20 cm
as in Alaska (Benson and Bowling 1973) and war-
rants additional trial.
100
DISCUSSION
12
8
4
4
8
12
0
Temperature Difference (C)
Figure 24. Mean vertical temperature structure con-
Nakamura and Magono (1982), Magono et al.
structed from surface observations north and south
(1988), Maki et al. (1986) and Harimaya and Maki
of S in the same manner as Figure 11. The database
(1988) observed inversions that formed over large
includes about two-thirds of the inversion days used
snow-covered basins, and measured regional
to construct Figure 11.
minimum temperatures beneath these inversions
27


 Previous Page
