450
24 C
A
a. 20 Jan '94 (0700)
26
400
28
30
32
28
Basin I
350
30
300
Z
32
34
36
W
250
Basin II
z
e
d
c
450
30 C
b. 27 Jan '94 (0545)
31
400
32
35
36
37
38
33
350
34
300
35
36
37
0
1 km
250
0
1
2
3
4
Scale Distance (km)
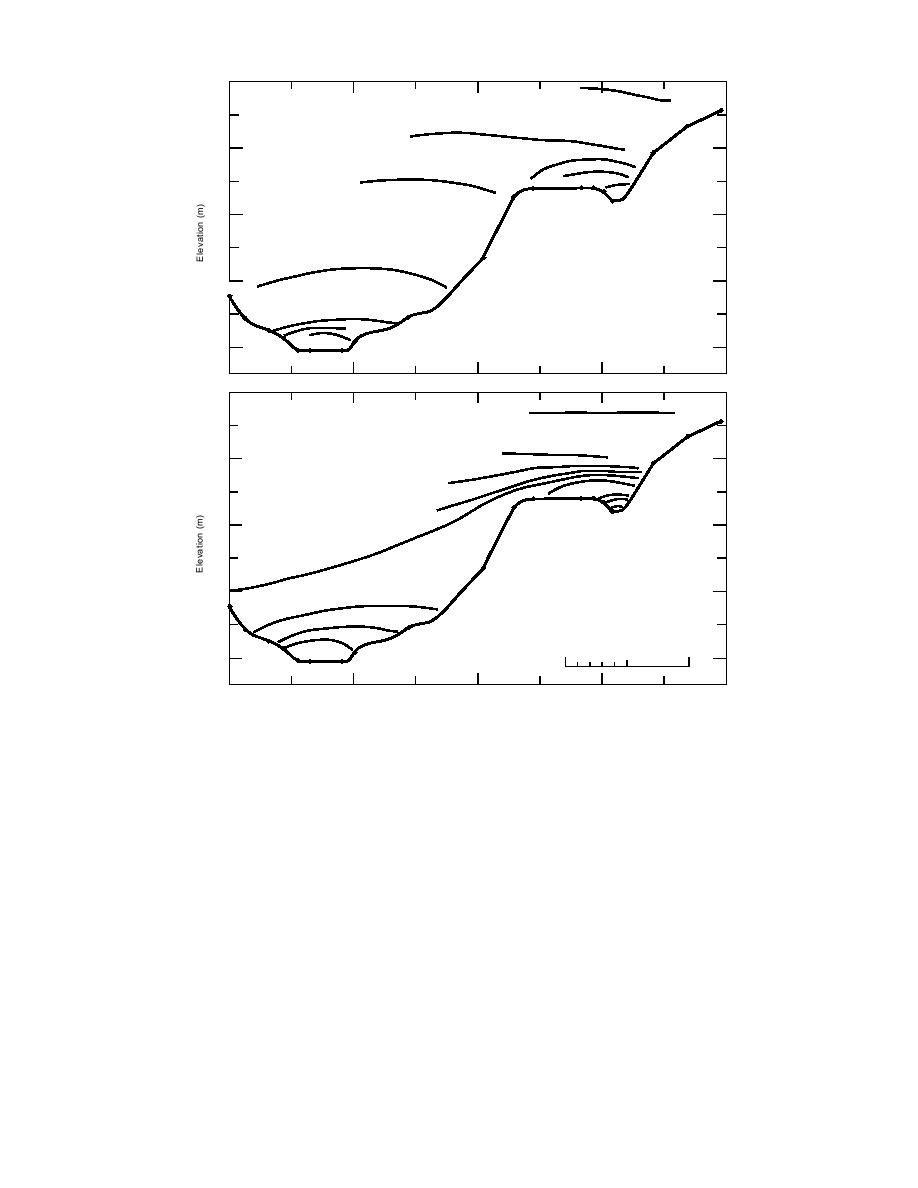
Figure 20. Inferred isotherms above the topographic cross section along ZWA on 20
(a) and 27 (b) January 1994, when very cold air was observed.
with a 10 to 13C temperature difference between
surement on bridge P on 20 January, but mea-
surements at k, l, m near river level indicate iso-
Clay Hollow observations and those near the apex,
and a difference of 16 to 18C between W and
thermal or inversion structure was present in the
river basin. There was 5C of temperature differ-
those near the apex.
ence within the basin surrounding W and in Clay
Strong advection of arctic air occurred again
Hollow. The apex (A) was 5 to 10C warmer than
on 26 January 1994, but warm advection had be-
Clay Hollow 0.6 km distant, 11C warmer than
gun at Mt. Washington at 0700EST 27 January,
W, and 5C warmer than Mt. Washington.
where 16C was observed. There were 70 cm of
Warm advection occurred during the night of
snow at Z at this time. A cross section was ob-
2021 January, producing an extreme inversion.
tained on 27 January (Fig. 20b), and the vertical
Measurement at P on 21 (Fig. 19b) January showed
profile of temperature repeated the inversion pro-
inversion structure in the lower basin. The air
file shown in Figure 11. A somewhat similar ad-
was about 5C warmer in basins I and II than on
vection event occurred 10 February 1994 but did
not produce air temperatures less than 35C.
the previous night, but inversion was very strong
24


 Previous Page
