200
100
VI
VII
VIII
IX
Basin V
k
lm
nop
r
s
u L
P
S
t
5
Lapse
>30
<3
0
5
Snow Depth (cm)
Inversion
>30
3-10
10-20
20-30
<3
0
0
10
20
30
40
Distance (km)
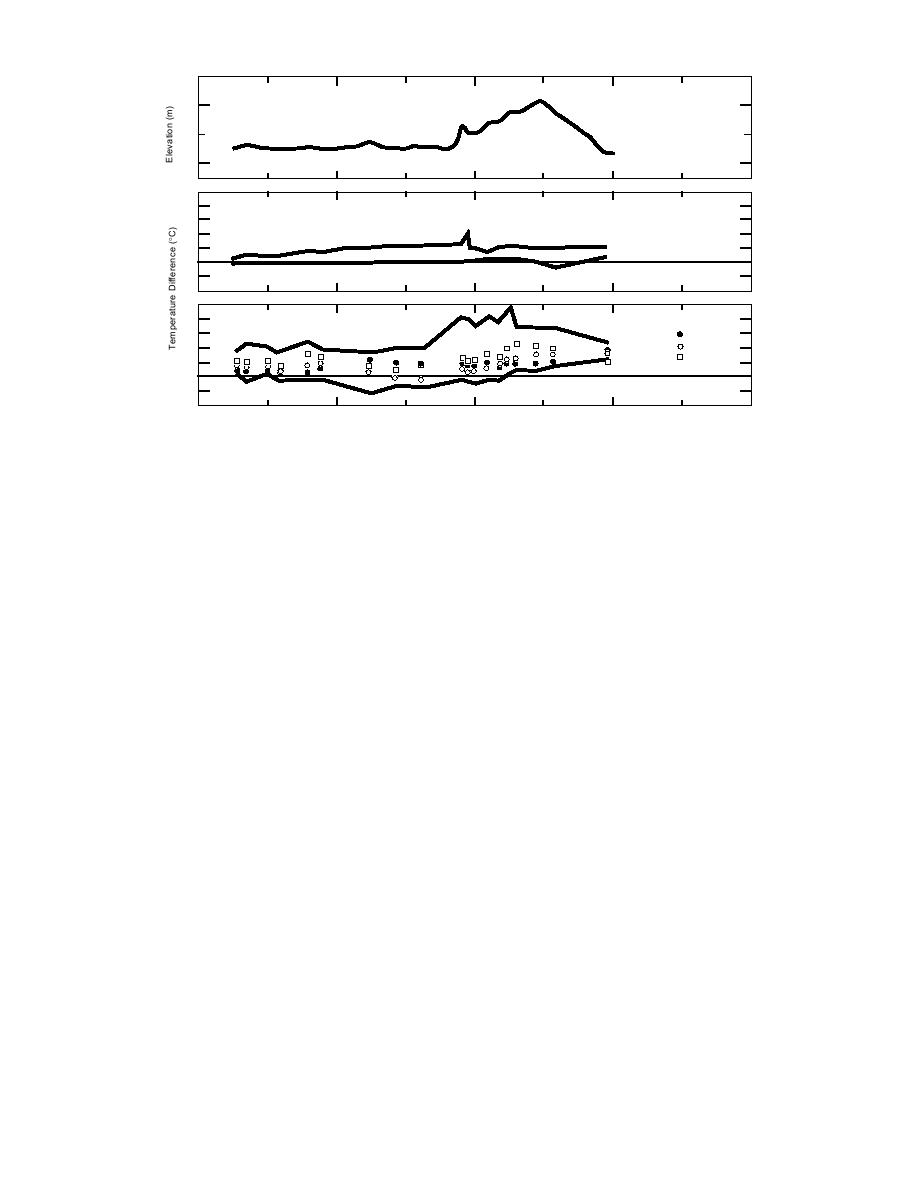
Figure 14. Mean northsouth cross sections of mean surface air temperature, with a terrain cross
section for reference. The morning air temperatures are stratified by snow depth and elevation
structure. The envelopes associated with maximum and minimum snow depth are plotted to guide
the eye.
difference subsets observed along the 30 km
We established, in Part I, that the temperature
northsouth observation path from P to L dis-
difference along the river plane was less than
1.6C over 30 km in 84% of observations. Figure
cussed in Part I. The mean temperature differ-
ences, with respect to the temperature at P, were
14 indicates that several small basins at slightly
calculated for these data subsets. Cross-sectional
higher elevation had morning air temperature dif-
analyses of the mean temperature differences, in-
ferences quite similar to points along the river
cluding the near river points for which frequency
plane. Temperature difference along the slope
distributions were given in Part I, are shown in
south of S was greater than that in those basins
Figure 14. Coordinating symbols are again noted
(V, VI, VII, and VIII). This difference is similar to
on the topographic cross section.
the slope basin temperature difference on the
Under lapse structure, air temperatures along
slopes connecting basins II, I, and the apex of
this transect are related to the temperature at the
observation, A. These temperature differences gen-
bridge P by the lapse rate. Because of the narrow
erally conform to the slope and basin theories of
range of temperature differences, only those mea-
Magono et al. (1982) and Maki et al. (1986). It does
sured with sparse snow cover (<3 cm) and com-
appear that depth and continuity of snow cover
plete snow cover (>30 cm) are plotted. These
may be additional variables influencing the morn-
points are connected to form an envelope to guide
ing temperature on slopes and in basins.
the reader. All other temperature differences un-
der lapse are enclosed in the plotted envelope.
This small temperature difference necessitated use
EXAMINATION OF
of mean values in this analysis.
SOME SINGULAR EVENTS
The temperature differences at these places are
much greater under inversion. All mean morning
The experiments, observations, and theories
temperature differences corresponding to the
describing winter slope and basin temperatures
snow cover categories are plotted at each obser-
in Hokkaido were primarily formulated to ex-
vation point. The envelope lines of the sparse and
plain the extremely cold air that occurred on a
total snow cover classes are again plotted to aid
few days. Hokkaido has very volcanic topogra-
in estimating the range of variation.
phy, and most of the work of Magono et al. (1982)
18


 Previous Page
