7 Feb 93
A
400
30
23 cm Snow
b
c
30
31
31
32
33
33
34
34
a
d
300
W
e
32
f
200
P
g
h
Basin IV
III
II
I
X
100
0
2
4
6
Distance (km)
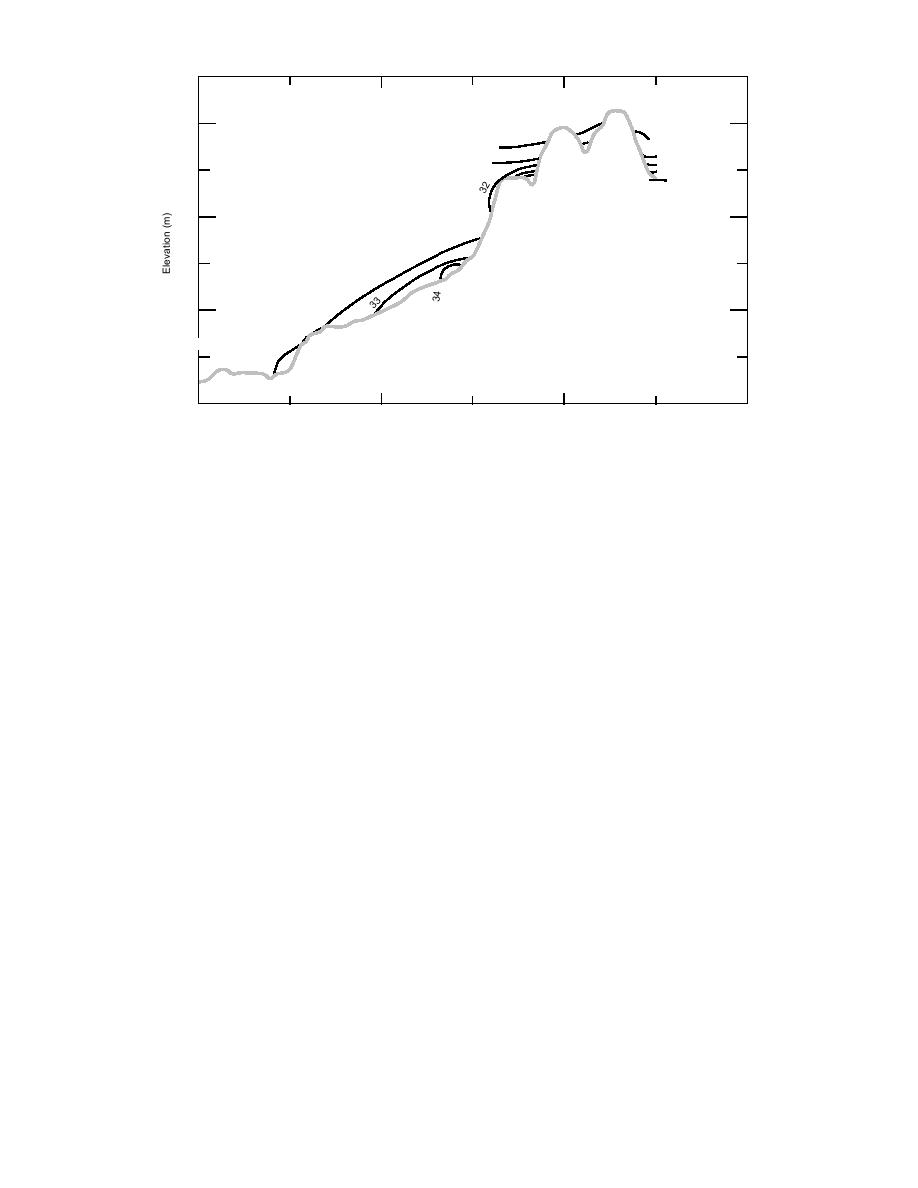
Figure 17. Temperaturetopographic cross section obtained 0700LCL 07 February 1993, the
coldest air observed during the winters 199093. The isotherms are inferred from intersection with
the 1.25 m above ground level surface.
separated by only 5 to 20 m per C. The analyses
the 22 January profile. There is lapse structure in
the lower layers, a small inversion over basin (II)
in Figures 17 and 18 indicate that the layers of
surrounding W, and near-isothermal structure in
coldest air above the small basins are at most a
the WA layers. The cold advection weakened
few tens of meters deep.
through 22 January, and a profile observed at
Additional vertical profiles for comparison with
1700E showed inversion structure forming above
this day are given in Figure 18, illustrating some
the elevation of W. A repeated observation at
extremes of temperature structure found near the
2200E22Jan showed inversions over both basins
Connecticut River. Nocturnal cooling following
(I and II), and 4 to 9C temperature diminution
cold advection is again shown in the vertical tem-
since 1700E. Strong warm advection began after
perature profile of 2 February 1993 (Fig. 18b).
2200E, which caused warming of 1C at W, 3C at
This is one of many days when an inversion
Clay Hollow, and 3 to 6C along the ridge about
formed above W, while most other observed
the apex. This provided 7C of inversion (150C/
temperatures diminished with increasing eleva-
km!) over basin I in Clay Hollow and a mean
tion.
inversion of 50C/km in the layer WA, while
The coldest "snowless" day of observation oc-
lapse structure remained in the Connecticut River
curred 1 January 1991 (Fig. 18c), with grass ex-
Basin below W. Magono et al. (1982) proposed
tending through less than 3 cm of a discontinuous
that the initial inversions in an area formed over
fresh dusting of snow. Another day with rather
snow-covered basins, decoupling the air in the
shallow snow, 10 December 1992, is shown in
basins from exchange with warmer tropospheric
Figure 18d. Significant radiational cooling (suffi-
air above for longer periods than adjacent slopes.
cient to reduce surface air temperature to less
This decoupling persisted for several hours after
than the frost point) occurred, producing large
the onset of warm advection, in the case shown in
frost crystals atop 5 cm of snow.
Figure 18f.
The changes in vertical temperature structure
Each panel of Figure 18 shows a layer of air, of
associated with cold and warm advection are
about 15-m thickness, in contact with the surface
shown in the profiles of 21 through 23 January
of the basin surrounding W, which is persistently
1991 in Figures 18e and f. Vigorous cold advec-
tion caused temperature diminution of 4 to 6C
of lesser temperature than nearby air. This smaller
basin appears to respond, over lesser snow cover,
between 2100E21Jan and 0600E22Jan, noted on
21


 Previous Page
