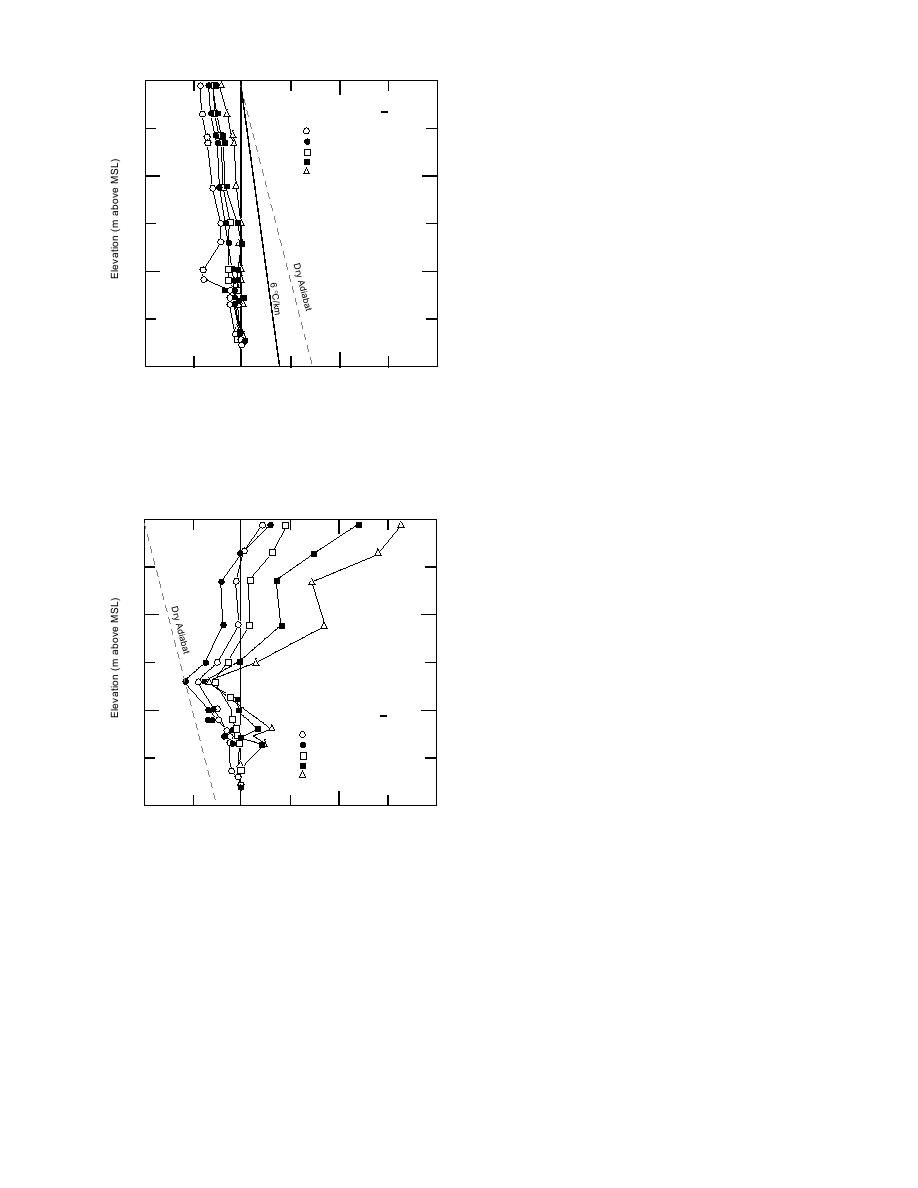
rate of 6C/km are included for reference in Fig-
400
A
ure 10, to guide interpretation of the temperature
TP (C)
structure. (Isothermal or inversion layers may be
Snow (cm)
N
<3
10.8
12
embedded in the general structure.) When snow
3-10
10.0
8
c
10-20
7.8
6
cover at Z was less than 10 cm and the cover
20-30
9.6
6
throughout the valley discontinuous, a mean lapse
>30
5.8
3
300
of 610C/km was present in the river basin be-
low 180-m msl elevation. There was a mean ten-
dency towards isothermal structure below 230 m,
W
and a lesser overall (AP) lapse structure as snow
depth increased and became more uniform
200
through the area. The inflection at 200-m eleva-
f
tion with minimum snow depth coincides with
the broadening of the narrow stream valley and
may be a cold air drain.
P
The mean temperature differences at the same
100
elevations, calculated for inversion days when
4
0
4
8
Mean Temperature Difference (C)
the temperature at A exceeded those at lower
elevation, are shown in Figure 11. The lower river
Figure 10. Mean elevation structure of surface air
basin was characterized by lapse or isothermal
temperature, stratified by snow cover, when lapse was
structure beneath the mean inversion elevation
apparent along PWA. The mean temperature at the
when thin or discontinuous snow cover prevailed.
reference point P is given in the reference block for each
There was inversion structure in the lower basin
category.
when snow was deeper and more uniform.
The analyses in Figures 10 and 11 support our
400
proposal that the temperature difference between
A
points A and W effectively defines the general
lapse or inversion structure of the near surface air
c
in the study area. The figures also indicate that
thicker and more continuous snow cover was ac-
300
companied by isothermal structure in the 100 m
of air just above the river plane when lapse was
present at greater elevation. An additional sur-
face-based inversion was present above the river
W
plane when an inversion in the AW layer was
200
present over thicker and more continuous snow
TP (C)
Snow (cm)
N
f
cover.
Compare the data blocks in Figures 10 and 11.
<3
10
12.2
3-10
8
12.2
The mean temperature observed at P increased
P
10-20
12
11.0
with increasing snow depth under lapse struc-
20-30
20
17.3
>30
10
22.6
ture. The mean temperature at P diminished as
100
4
0
4
8
snow depth increased under inversion structure.
Mean Temperature Difference (C)
Uniform snow cover along the river plane coinci-
Figure 11. Mean elevation structure of surface air
dent with the elevation of P enhanced cooling
temperature, stratified by snow cover, when inversion
and stratification in the largest, lowest basin dur-
was apparent along PWA.
ing this period of study. Only well-organized
(usually precipitating) low pressure systems
were able to displace this stable air in early morn-
plotted in Figure 10, and the five subsets repre-
ing hours. The relatively few occurrences of lapse
senting inversion are plotted in Figure 11. The
temperature structure over thick uniform snow
snow depths at Z defining the subsets and the
cover accompanied or followed precipitation.
mean reference temperature at P for each subset
There were many occurrences of precipitation fall-
are noted in a data block in each figure.
ing through inversion temperature structure in
A broken line representing the dry adiabatic
one or more layers.
lapse rate and a solid line representing a lapse
15


 Previous Page
