1.65
1.32
0.99
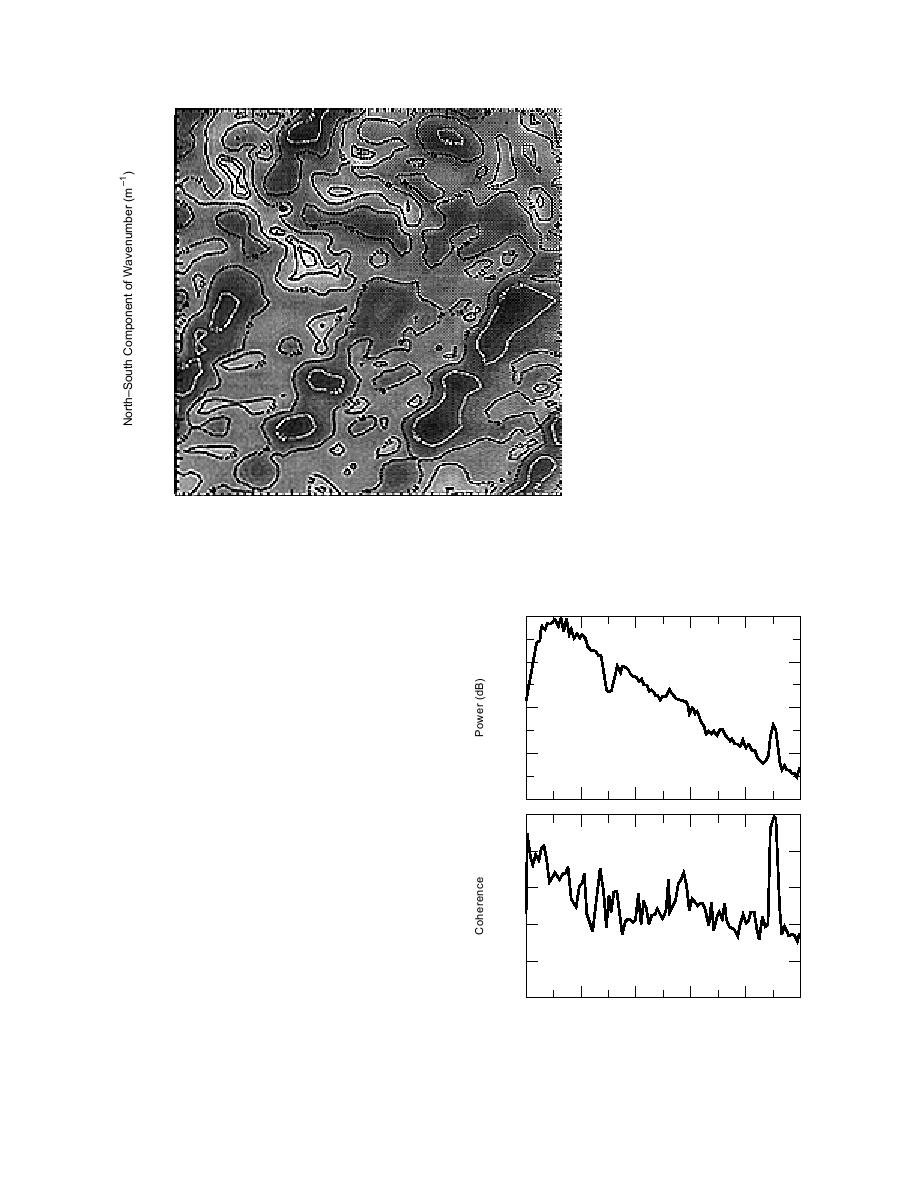
Figure 29. Broadband ML wave-
0.66
number spectrum for vertical geo-
Figure 2729
phone subarray. The processed fre-
0.33
Figure 31
quency band is 15 to 78 Hz. High-
Figure 33
amplitude linear ridge along a
wavenumber space direction of 140
0.00
Figure 3641
indicates a source position of 40.
The locations of spectral maxima
0.33
indicate waves propagating at 223
and 342 m s1.
0.99
1.32
1.65
1.65
1.32
0.99
0.33
0.00
0.33
0.66
0.99
1.32
1.65
EastWest Component of Wavenumber (m1 )
Linear Grey Scale: White Regions = 3 dB
Black Regions = 42 dB
the resulting wavenumber spectra.
0
The next ML wavenumber spectra we consider
Amplitude Spectrum
are for the vertical-geophone signal vector pro-
40
duced by a vertically delivered sledgehammer
blow (see Fig. 20). The source location was on the
road 50 m south of the CPA at θ = 78. Figure 30
80
displays the average array power and coherence
spectra. The OBAFFT parameters used for the
120
power, coherence, and wavenumber spectra were
a signal length of 2000 points segmented into three
blocks of 1024 points, each overlapped by 53% and
160
tapered with a Blackman window. The 95% vari-
1.0
^
ance bounds were R (0.46, 3.96) with 5.51 d.f. The
25-Hz ML wavenumber spectra based on this
0.8
record are shown in Figure 32. The average array
coherence at 25 Hz is 0.64. The location of the
0.6
spectral maximum in the wavenumber estimate
gives θ = 74 with a phase velocity of 232 m s1.
0.4
5.3. Moving sources
0.2
Coherence Spectrum
The first source we consider (Figure 22) is an
M60 tank travelling along the road from south-
0
0
40
80
120
160
200
west to northeast at 4.5 m s1. This was recorded
Frequency (Hz)
when the vehicle was 300 m to the southwest of the
CPA. The OBAFFT parameters used to produce
Figure 30. Average array spectra for vertical geophone
the wavenumber, power, and coherence spectra
subarray to stack of eight hammer blows.
25


 Previous Page
