0
Amplitude Spectrum
40
80
Proc. Band
120
1.0
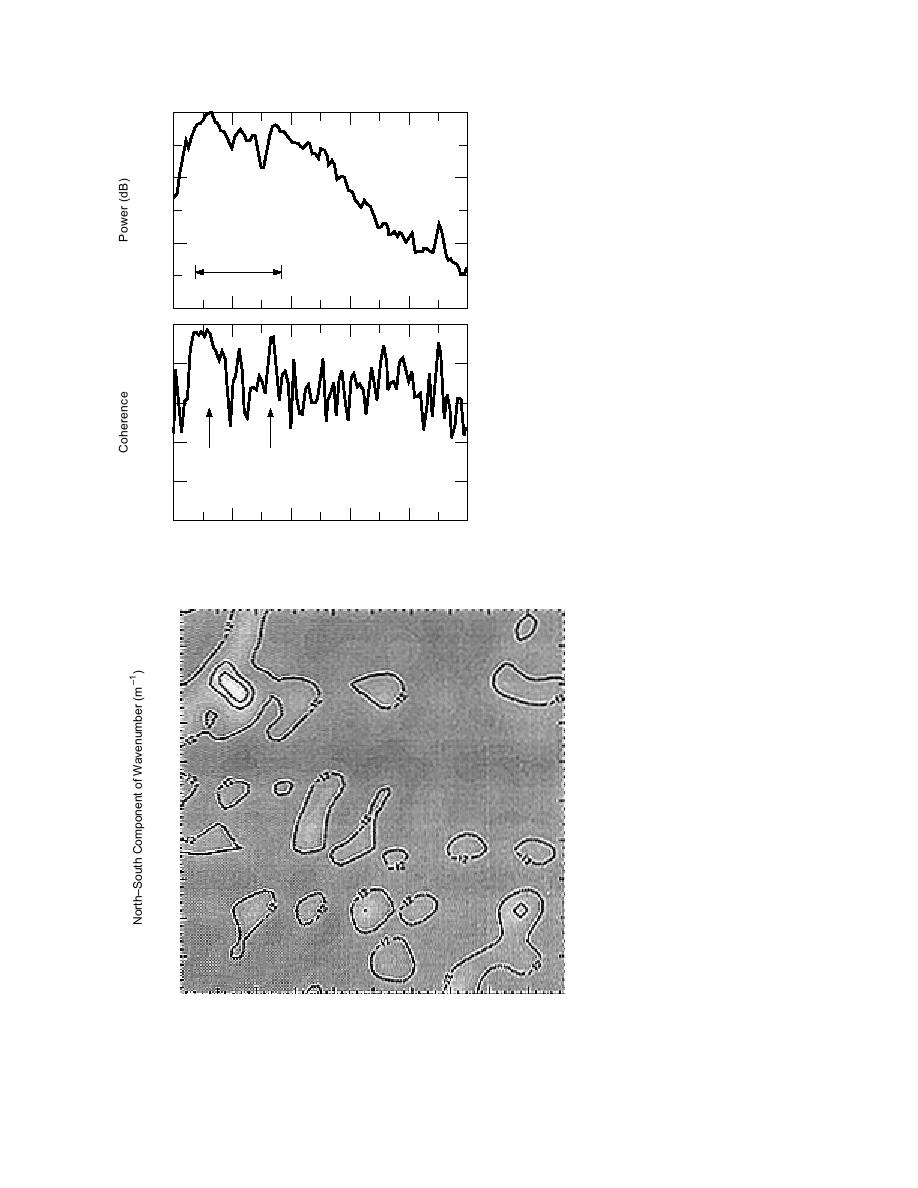
Figure 26. Average array spectra for vertical
geophone subarray to .45 caliber pistol shot.
0.8
0.6
0.4
Surface
W
W ir
A
ave
ave
0.2
Coherence Spectrum
0
0
40
80
120
160
200
Frequency (Hz)
1.65
1.32
0.99
0.66
Figure 2729
Figure 27. ML wavenumber spec-
0.33
Figure 31
trum at 78 Hz for vertical geophone
subarray. The location of the spectral
Figure 33
maxima indicates a source direction
0.00
Figure 3641
of θ = 40 and a phase velocity of
338 m s1.
0.33
0.99
1.32
1.65
1.65
1.32
0.99
0.33
0.00
0.33
0.66
0.99
1.32
1.65
EastWest Component of Wavenumber (m1 )
Linear Grey Scale: White Regions = 3 dB
Black Regions = 42 dB
23


 Previous Page
