m s1 from southwest to northeast. An 11-Hz ML
the 95% confidence level. In this extremely over-
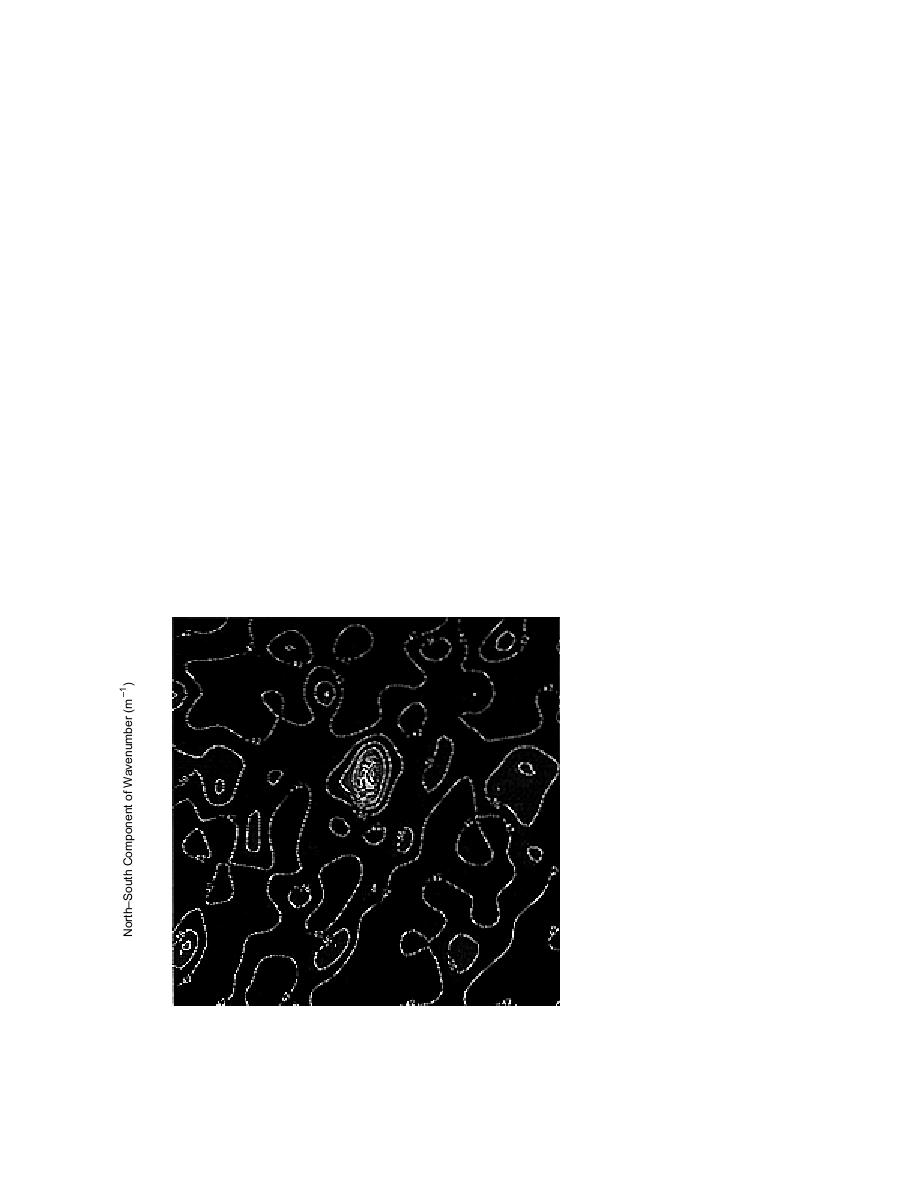
wavenumber spectrum is shown in Figure 36. It
lapped region the variance bounds are slightly
was formed using a series length of 2000 points
better than those found for the Blackman window
segmented into 20 blocks; each block had 1024
function used in the previous example. Figure 37
points, was tapered by a Blackman window, and
is a notable wavenumber estimate in that it has an
overlapped the preceding block by 95%. The 95%
exceptionally peaked spectral maximum, which
indicates a source direction of 258 and a phase
confidence bounds on the variance of the
^
crosspower matrix was R (0.38, 9.39) with 2.83
velocity of 219 m s1. There are several subtle
d.f. The average array coherence at 11 Hz was 0.92.
differences between Figures 37 and 38. The first is
The variance estimate leads one to expect that no
the occurrence of a relatively pronounced spectral
significant improvement in the wavenumber spec-
side lobe in Figure 37 that is 18 dB smaller than the
tra will result from such highly overlapped blocks.
spectral maximum. In addition, the background
This is not the case, as will be shown later.
energy level in Figure 37 is approximately 33 dB
The wavenumber spectrum in Figure 36 is no-
while that of Figure 36 was approximately 45 dB.
table in several respects. It has an extremely sharp
The next two wavenumber estimates investi-
spectral maximum with background energy levels
gate the impact of reducing the number of blocks
as low as 45 dB. The highest side lobe in wave-
in the OBAFFT. In Figures 38 and 39 we process a
number space is 30 dB below the maximum. The
signal length of 2000 points, blocked into seg-
location of the spectral maximum gives a source
ments of 1024 points, with each overlapped by
direction of 258 and a propagation velocity of 219
53%, giving a total of three blocks. In the case of
m s1.
Figure 38 we apply a Blackman window taper to
The ML wavenumber estimate shown in Figure
each block, whereas the wave number estimate
38 uses the same signal vector as that of Figure 36.
shown in Figure 39 used a boxcar window func-
tion.
In this spectrum the OBAFFT parameters are iden-
In Figure 38 the spectral maximum is sharply
tical except the blocks are boxcar windowed. The
peaked, indicating a source direction of 258 and a
^
variance estimate is R (0.42, 5.83) with 3.89 d.f. at
1.65
1.32
0.99
0.66
Figure 36. ML wavenumber esti-
Figure 2729
mate at 11 Hz for waveforms shown
0.33
Figure 31
in Figure 35: Blackman taper, 20
blocks (at 95% overlap), segment
Figure 33
length = 1024; produces a source
0.00
Figure 3641
direction of 258 with a velocity of
219 m s1.
0.33
0.99
1.32
1.65
1.65
1.32
0.99
0.33
0.00
0.33
0.66
0.99
1.32
1.65
EastWest Component of Wavenumber (m1 )
Linear Grey Scale: White Regions = 3 dB
Black Regions = 42 dB
29


 Previous Page
