When using reasonable OBAFFT parameters,
The composite uses a range of temporal fre-
the wavenumber bias effect was negligible for
quencies from 9.77 to 29 Hz with the majority of
signal vectors observed from sledgehammer blows
the records using the 11-Hz bin. All the estimates
or blank pistol shots. Thus, the wavenumber bias
used 2000-point signal lengths, segmented into
problem is most likely associated with the charac-
three blocks of 1024 points, each overlapping the
teristics of the M60. Given the difficulty in produc-
previous by 53%. A Blackman taper was used for
ing accurate wavenumber estimates from the ver-
10 of the wavenumber estimates, with the remain-
tical-geophone array in the 29-Hz peak power bin
ing five estimates using a boxcar window taper.
of the M60 source, and the coincident occurrence
Using the boxcar window, the 95% confidence
of large energy levels at 29 Hz in the microphone
bounds on the crosspower matrix were
^
R (0.42, 5.85) with 3.9 d.f. The decision to use
and geophone power spectra (Fig. 25 and 26), it is
tentatively proposed that the bias effect may be
either a boxcar or Blackman taper was based on
aggravated by interference between surface waves
the coherence spectra and the consistency of the
and acoustic energy coupling near the geophone
velocity estimates of the resulting wavenumber
and source movement.
spectra.
5.5. Spatial frequency bias from moving sources
5.4. Affect of spectral estimation parameters on
To show how changes in processing param-
beam response
eters can affect wavenumber estimation for the
In the preceding sections we demonstrated that
moving M60, we consider a series of wavenumber
ML wavenumber spectra from small seismic ar-
estimates using the same data set but applying
rays can produce accurate direction estimates with
slightly different OBAFFT parameters. In each
careful choice of transformation parameters. An-
case it will be shown how the estimation param-
other result is that small differences in the fre-
eters lead to biased wavenumber estimates or to a
quency-domain processing parameters often have
reduction in the SNR as measured by the back-
large effects on the wavenumber estimate. Such
ground energy level of the wavenumber spectrum.
effects are termed a wavenumber bias. In this
section several examples of the wavenumber bias
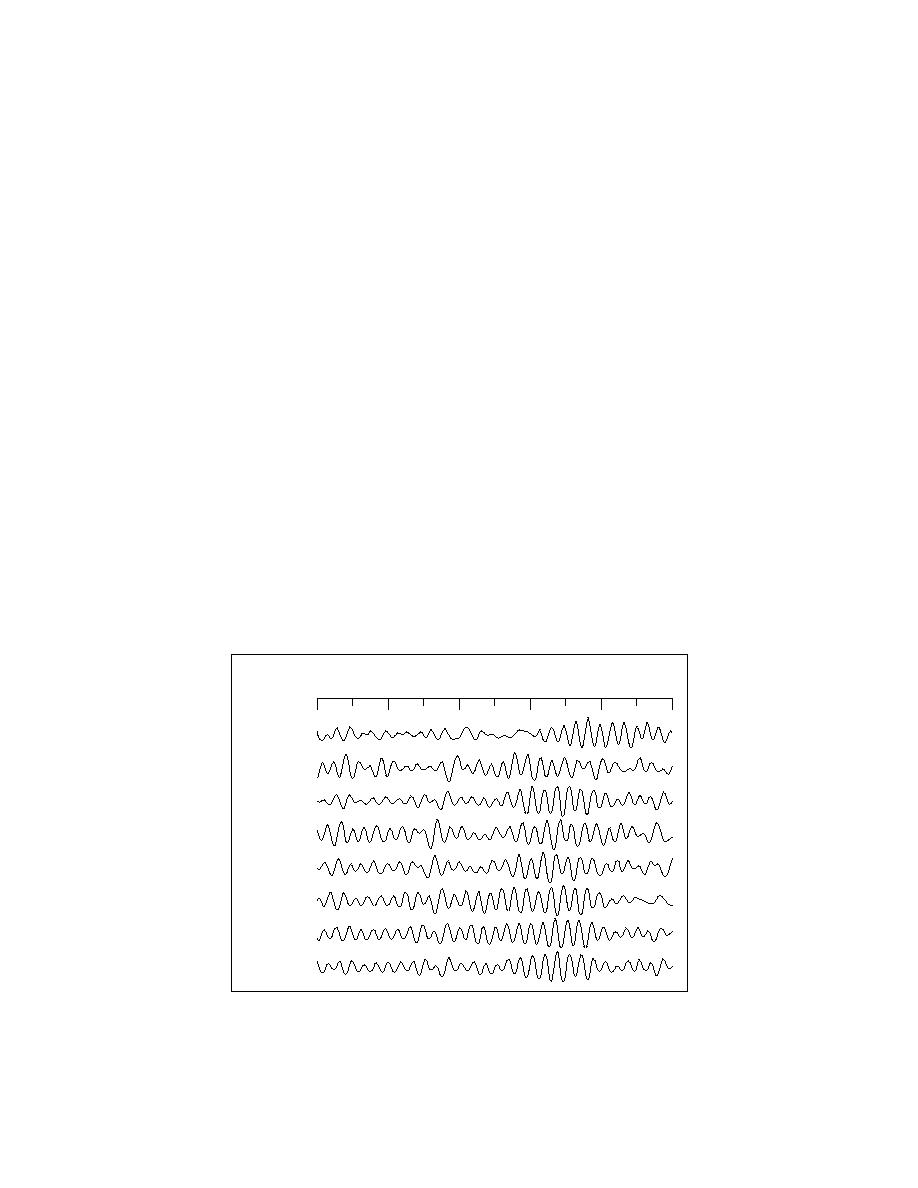
Consider the signal vector shown in Figure 35
phenomenon are demonstrated for the M60 tank.
for an M60 tank moving along the road at 4.5
Time (s)
0
0.2
0.4
0.6
0.8
1.0
Elm
N
Amp
(
o.
dB)
5
2.6
4
3.6
3
0.1
2
2.3
0.2
1
7
1.4
8
1.6
9
0
Figure 35. Time-domain response of vertical geophone subarray to M60 tank
moving at 4.5 m s1 along the road approximately 100 m southeast of the CPA.
These waveforms correspond to position 8 in the composite plot shown in
Figure 35.
28


 Previous Page
