

1.65
1.32
0.99
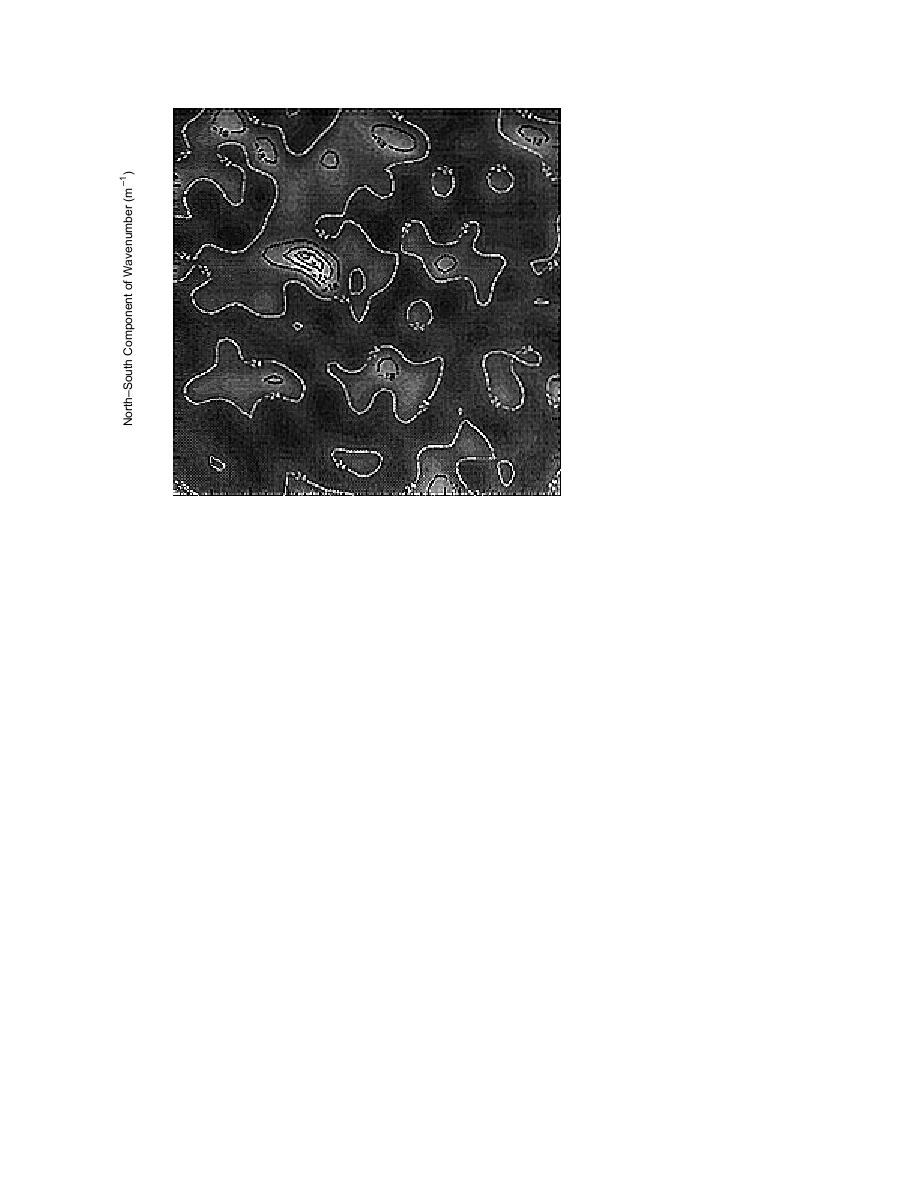
Figure 28. Estimated ML wave-
number spectrum at 23 Hz for verti-
0.66
cal geophone subarray. Location of
Figure 2729
spectral peak gives a source direction
0.33
of θ = 37 and a phase velocity of
Figure 31
223 m s1.
Figure 33
0.00
Figure 3641
0.33
0.99
1.32
1.65
1.65
1.32
0.99
0.33
0.00
0.33
0.66
0.99
1.32
1.65
EastWest Component of Wavenumber (m1 )
Linear Grey Scale: White Regions = 3 dB
Black Regions = 42 dB
wavenumber. Thus, all incoming source wave-
Selection of these parameters allowed the spectral
numbers are oriented 180 away from the source
estimate of each block to retain a high degree of
independence with emphasis on the resolution of
direction.
specific frequency bins. In Figure 29 there are three
Figure 28 is a 23-Hz ML wavenumber estimate
spectral maxima that have energy levels greater
of the same pistol shot record. The time interval
than 3 dB. All three trend along a high-amplitude
considered encompasses the later portion of the
wave train between 0.2 and 0.5 s. There were 500
"ridge," indicating a source direction of roughly
40. The wavenumber peak with the smallest
points in this interval. The time-domain move-out
analysis indicated a phase velocity of roughly
220 m s1 in this interval. A block length of 256
normalized by a frequency of 23 Hz. The
points overlapped by 60% was used, giving four
wavenumber peak with the intermediate magni-
tude yields a phase velocity of 342 m s1 when
blocks in the estimated spatial correlation matrix.
A boxcar window taper was applied. The average
normalized by 78 Hz.
array coherence in the 23-Hz bin was 0.8. The
The above series of wavenumber spectra and
wavenumber spectra in Figure 28 give a source
the time-domain plots clearly show the existence
direction of θ = 37 and a phase velocity of 223 m
of an acoustically induced seismic surface wave.
s1. These values agree with the known source
In considering the ML wavenumber spectra it
direction and the time-domain estimates of the
should be remembered that the wavefield was
propagation velocity.
generated by a nearly ideal stationary point source.
The last beamformer response for the pistol
The OBAFFT parameters used in the ML
shot is shown in Figure 29. This is a broadband ML
wavenumber spectra were chosen through trial
estimate processed on an 800-point time interval
and error, and in many circumstances reasonable
between 0.1 and 0.5 s. A block length of 128 points
parameters did not yield intelligible beam re-
was chosen with no block tapering. The block
sponses. The above set of wavenumber estimates
overlap was 40%, giving nine blocks. The fre-
(Fig. 27 to 29) serve as a testament to the impact of
quency band evaluated was from 15 to 78 Hz.
the frequency domain estimation methodology on
24

 Previous Page
