1.65
1.32
0.99
0.66
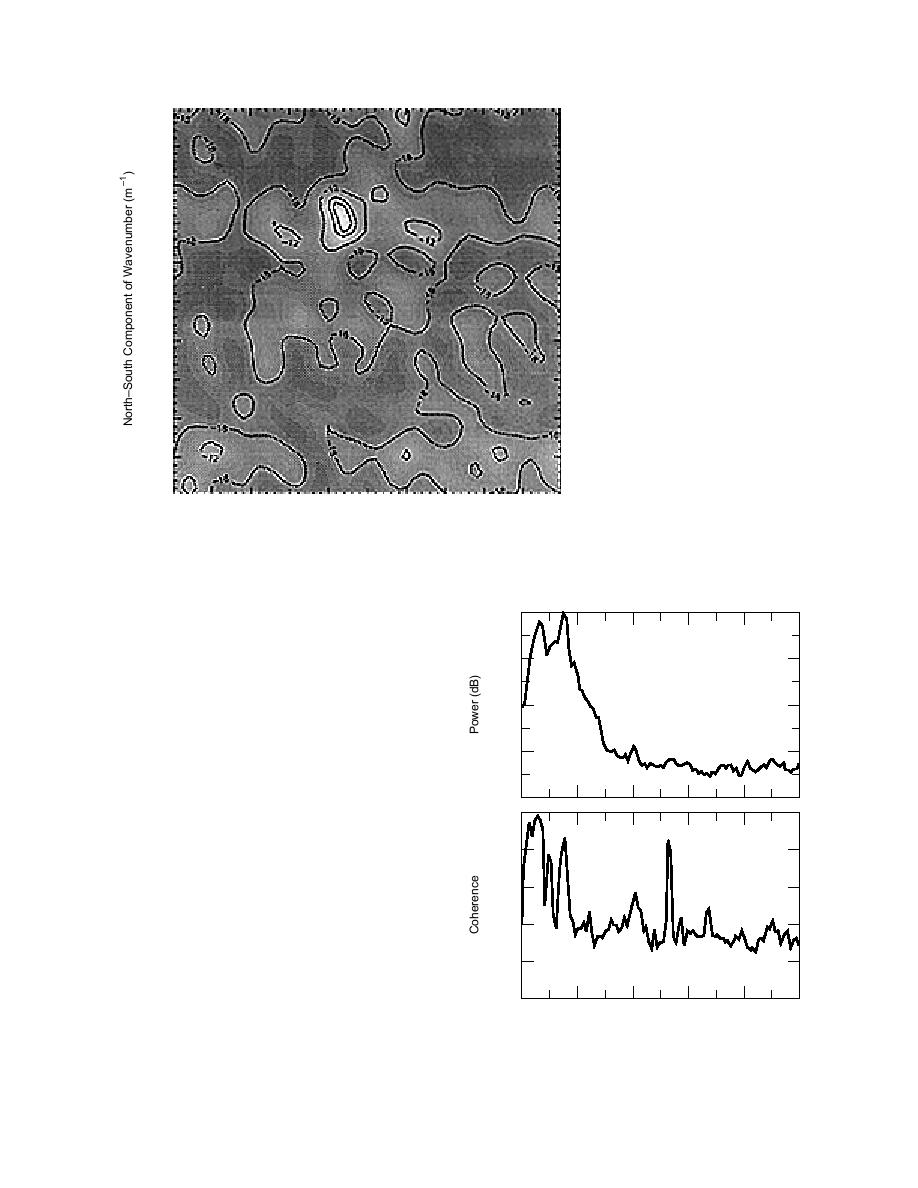
Figure 31. Estimated ML wave-
Figure 2729
number spectrum at 25 Hz for ver-
0.33
Figure 31
tical geophone subarray for ham-
Figure 33
mer blows. Peak amplitude gives a
source direction of θ = 74 and a
0.00
Figure 3641
phase velocity of 232 m s1.
0.33
0.99
1.32
1.65
1.65
1.32
0.99
0.33
0.00
0.33
0.66
0.99
1.32
1.65
EastWest Component of Wavenumber (m1 )
Linear Grey Scale: White Regions = 3 dB
Black Regions = 42 dB
0
are a series length of 2000 points segmented into
three blocks of 1024 points, each overlapped by
Amplitude Spectrum
53%, and tapered with a Blackman window func-
40
^
tion. The 95% confidence bounds are R (0.46, 3.96)
with 5.51 d.f. Figure 32 shows the average array
power and coherence spectra. There is a peak in
80
the power spectrum at 11 Hz that has a coherence
of 0.94. The 11-Hz ML wavenumber spectrum
120
(Fig. 33) estimates the source direction as θ = 258
with a phase velocity of 219 m s1.
The result shown in Figure 33 is typical of ML
160
wavenumber estimates obtained from the M60 in
1.0
the 9- to 15-Hz band using the vertical-geophone
subarray. To demonstrate this, consider Figure 34,
0.8
which is a composite of direction and velocity
magnitudes estimated from ML wavenumber spec-
0.6
tra for a consecutive series of M60 vehicle records.
The location of each direction position is sequen-
0.4
tially labeled 1 to 16. All records in this composite
are from the same M60 drive-by series, with the
0.2
Coherence Spectrum
tank moving from southwest to northeast along
the road at a constant speed of 4.5 m s1. The most
0
0
40
80
120
160
200
distant records in this series were at positions 1
Frequency (Hz)
and 16, which correspond to vehicle ranges of 500
and 300 m, respectively. At position 11 the tank is
Figure 32. Average array spectra for vertical geophone
50 m from the array's coordinate origin.
subarray to M60 tank moving at 4.5 m s1.
26


 Previous Page
