1.0
0
20
0.8
40
0.6
60
0.4
80
0.2
100
0
120
0
50
100
150
200
0
50
100
150
200
1.0
0
20
0.8
40
0.6
60
0.4
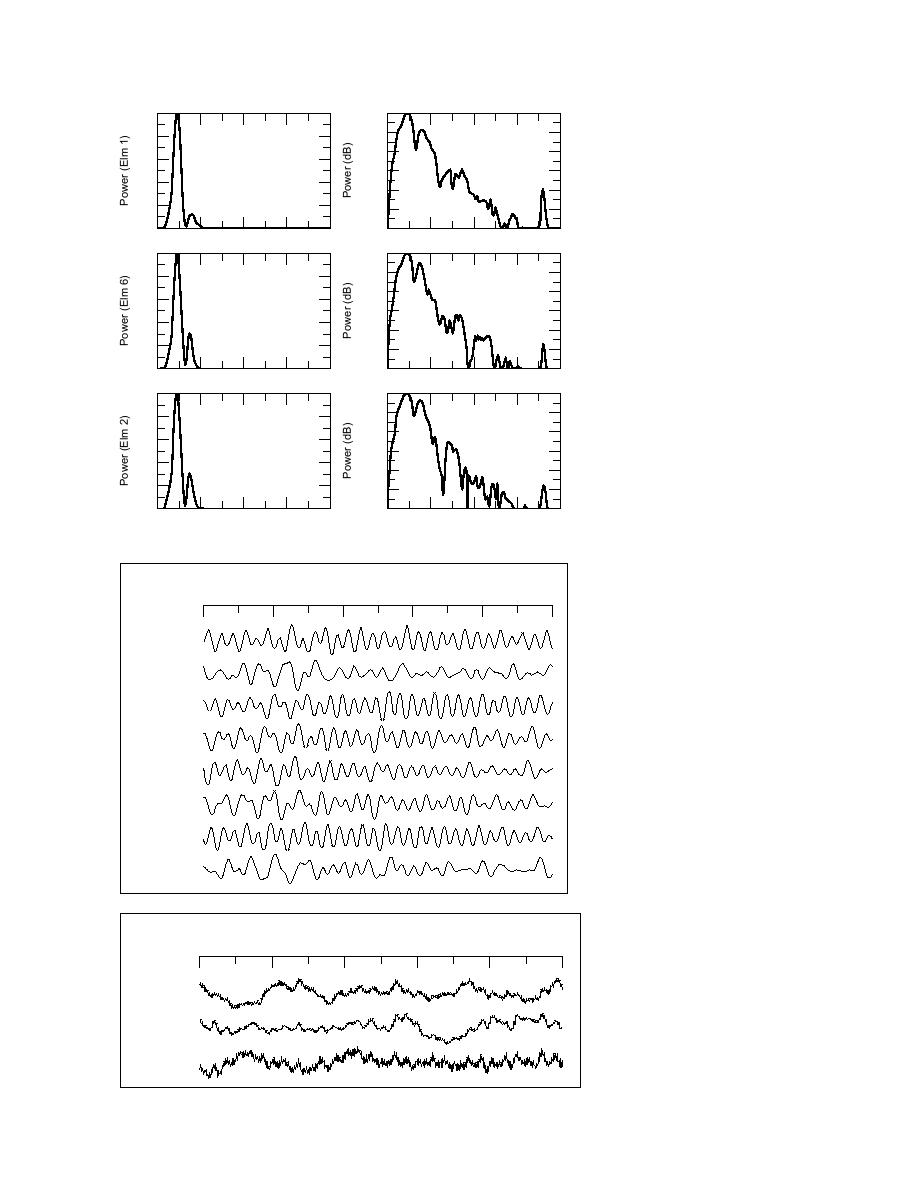
Figure 21. Hammer blow spectra
80
from center array elements for ver-
0.2
100
tical geophone subarray.
0
120
0
50
100
150
200
0
50
100
150
200
1.0
0
20
0.8
40
0.6
60
0.4
80
0.2
100
0
120
0
50
100
150
200
0
50
100
150
200
Frequency (Hz)
Frequency (Hz)
Time (s)
0
0.2
0.4
0.6
0.8
1.0
Elm
N
Amp
(
o.
dB)
5
6.1
4
1.6
Figure 22. Time-domain vertical
3
6.8
geophone subarray response to
M60 tank moving at 4.5 m s1.
2
4.7
1
6.4
7
3.0
8
6.6
9
0
Time (s)
0
0.2
0.4
0.6
0.8
1.0
Elm
N
Amp
(
Figure 23. Time-domain micro-
o.
dB)
phone subarray response to M60
2
7.0
tank moving at 4.5 m s1.
1
1.3
6
0
20


 Previous Page
