1.65
1.32
0.99
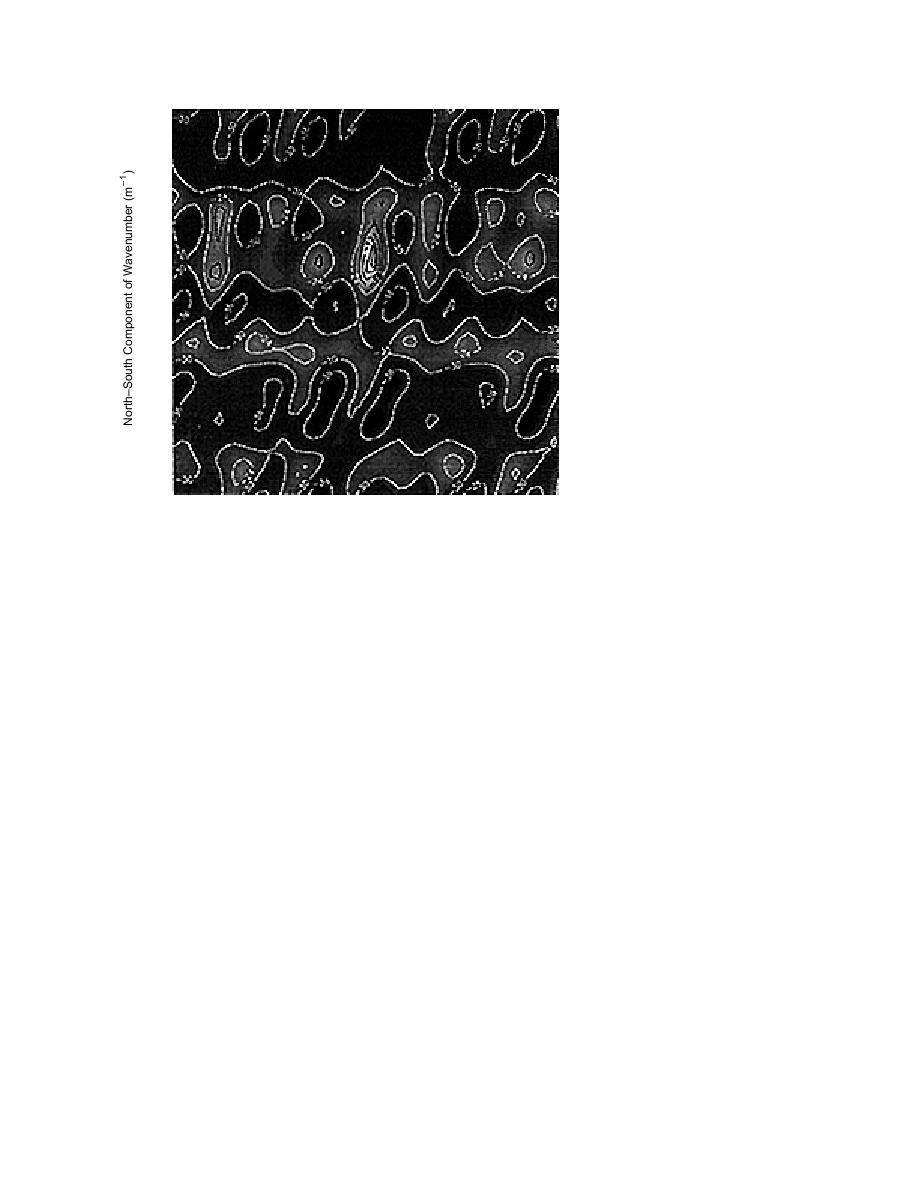
Figure 37. ML wavenumber esti-
0.66
mate at 11 Hz for waveforms shown
in Figure 35: boxcar taper, 20 blocks
Figure 2729
(at 95% overlap), segment length =
0.33
Figure 31
1024; produces a source direction of
Figure 33
258 with a velocity of 219 m s1.
0.00
Figure 3641
0.33
0.99
1.32
1.65
1.65
1.32
0.99
0.33
0.00
0.33
0.66
0.99
1.32
1.65
EastWest Component of Wavenumber (m1 )
Linear Grey Scale: White Regions = 3 dB
Black Regions = 42 dB
phase velocity of 219 m s1. The highest secondary
between blocks. Thus, if one is interested in esti-
mating the phase angle difference (i.e., calculat-
side lobe is at 21 dB with an overall background
ing a spatial correlation matrix) between chan-
energy level of 36 dB. In contrast, the wavenumber
nels in an array and the signal duration is
estimate shown in Figure 39 indicates a source
direction of 255 and a phase velocity of 271 m s1.
fixed, it is advantageous to use a large number of
The 3 direction difference and 52 m s1 velocity
highly overlapped blocks (compare Fig. 36 and
Fig. 38).
difference between Figures 38 and 39 is a mild
Continuing with the same data, we contrast the
example of the wavenumber bias effect. In addi-
previous four satisfactory wavenumber spectra
tion, applying the boxcar window effectively re-
with another pair of 11-Hz ML wavenumber esti-
duces the SNR of the beamformer in the sense that
mates formed using a single block of 512 points.
the background energy level of Figure 38 increases
This is theoretically more than twice the signal
by 6 dB in Figure 39.
duration needed to adequately observe an 11-Hz
Comparing Figures 36 and 37 with 38 and 39 we
note that there seems to be significant benefit in
using a larger number of highly overlapped blocks.
The 11-Hz ML wavenumber spectrum in Fig-
Each estimate of the phase difference between two
ure 40 applied a Blackman window taper to the
channels for a given block of data is calculated
block of data, and the 11-Hz ML wavenumber
from a comparison of two vectors. Each vector has
spectrum in Figure 41 used a boxcar window
a magnitude and a phase, both of which vary with
function. Figure 40 has an acceptably peaked spec-
tral maximum indicating a source direction of 258
time, and each contains a small amount of random
and a phase velocity of 219 m s1. However, this
noise. The amplitude at a given frequency will
vary slowly across blocks for a given channel,
estimate has a considerably higher background
indicating highly correlated blocks. The phase
energy level (18 dB) compared with the previous
angle variation across blocks changes (rotational
examples. The highest spectral side lobe has an
orientation) rapidly compared with the amplitude
energy level of 12 dB. In a rather dramatic con-
variation, indicating a lower degree of correlation
trast, we note that the ML wavenumber spectrum
30


 Previous Page
