Time (s)
0
0.2
0.4
0.6
0.8
1.0
Elm
N
Amp
(
o.
dB)
5
1.1
4
0.9
3
1.6
2
1.8
6
2.1
1
1.5
7
1.2
8
0.8
9
0
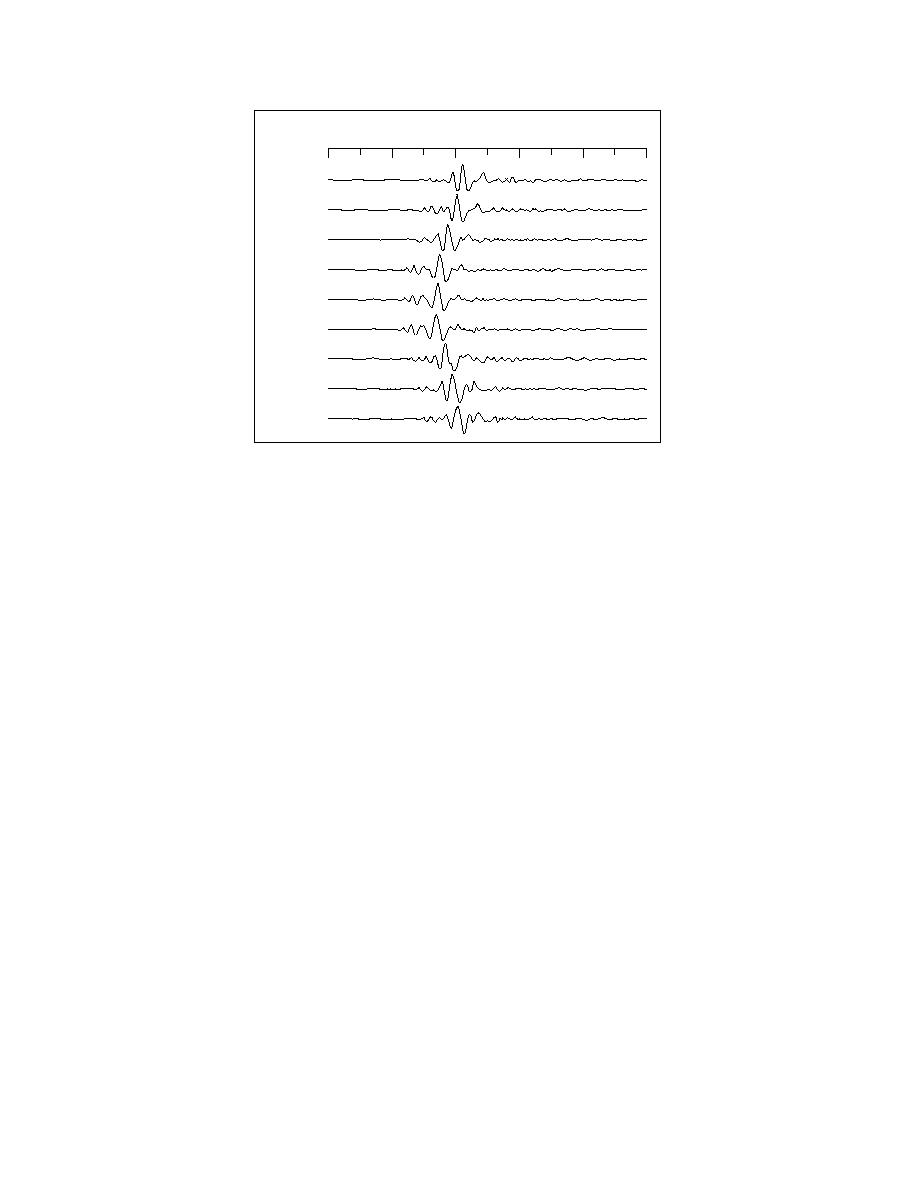
Figure 20. Vertical geophone subarray response to a stack of eight
hammer blows. The element number and peak-to-peak amplitude are
listed to the left of each trace. The amplitudes are arbitrarily normalized
to the trace from element 9.
10 and 30 Hz, with an additional spectral peak
4.3. Moving seismicacoustic sources
near 70 Hz.
Recordings of a tank were also made as a U.S.
Army M60 tank was driven up and down the test
track at various speeds. A malfunction with the
4.2. Impulsive seismic source
Figure 20 shows a series of vertical-component
recording equipment prevented continuous sig-
geophone waveforms obtained by digitally stack-
natures from being obtained, so a series of 1-s-long
ing eight vertically delivered sledgehammer blows.
signature snapshots was recorded. The 10 tank
The source position is located on the road at a point
signatures examined here were recorded between
1256 and 1259 on 17 February.
50 m to the southwest of the CPA at a direction of
78. Using eq 32 it is found that the phase velocity
We now discuss the spectral properties of an
is approximately 220 m s1. The power spectra for
M60 tank moving at approximately 4.5 m s1 (10
mph). The vehicle's direction (θ) during this record
the three center elements from this array (Fig. 21)
interval was approximately 260. Figures 22 and
indicate that the signal is broadband with peaks at
20 and 40 Hz.
23 present the time-domain waveforms observed
The pistol and sledgehammer sources indicate
by the vertical-geophone and microphone
that the dominant seismic energy carrier is a sur-
subarrays, respectively. In the vertical-geophone
face wave propagating with a phase velocity of
waveforms there is a high degree of both temporal
approximately 220 m s1 and having a mode fre-
and spatial variation in the signals. The peak-to-
quency of between 20 and 30 Hz. Analysis of the
peak amplitude variation across the array ranges
pistol shot records clearly shows that high-energy
up to 6.6 dB. Since the spatial variations between
acoustic sources couple strongly with the ground
array elements were not consistent from record to
to produce surface waves. This is consistent with
record, it is unlikely that the variations are due to
the previous findings of Albert (1989). In addition
geophone coupling to the ground or to variation in
to the acoustically induced seismic surface wave,
the snow cover.
the geophone is also excited by the airborne pres-
Spectra were estimated using a total signal
sure pulse. These propagation modes can interfere
length of 2000 points segmented into three blocks
and may be a source of difficulty for beamforming
of 1024 points. Each block is overlapped by 53%
processors.
and tapered using a Blackman window. Figure 24
19


 Previous Page
