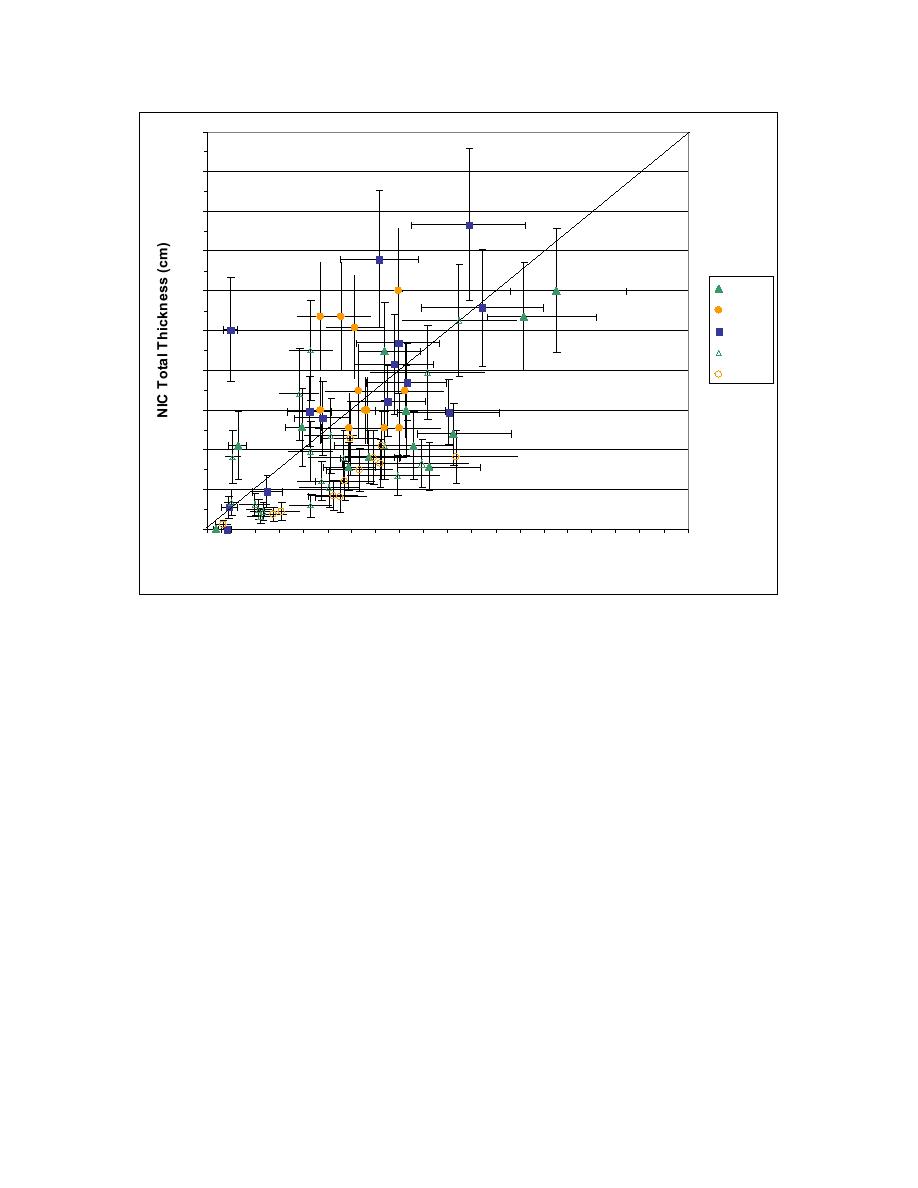
r2 - 0.58
200
MAE - 25.50
RMSE - 31.8
180
160
140
May-95
120
Jun-95
Aug-95
100
May-98
80
Jun-98
60
40
20
0
0
20
40
60
80
100
120
140
160
180
200
Ship Total (Level+Snow+Ridge) Thickness (cm)
Figure 6. Scatterplot comparing the thickness estimated from the NIC ice chart and ship-based
measurements for the growth season of 1995 and 1998.
The year-to-year variability in thickness is evident in Figure 7 with much thinner sea ice
in 1998, a strong El Nino year, as compared to 1995. Although these scatterplots show overall
agreement between NIC information and in situ ship-based observations, we currently make use
of the GIS to further investigate spatial bias that may be attributed to differences from analysts'
level of experience, remotely sensed data analyzed, and/or procedural changes at the NIC.
Overall, the NIC ice chart thickness estimates correlate reasonably well with in situ
observations. Both of these data sets are currently the only continental scale data to examine the
seasonal and interannual thickness distribution and mass balance of sea-ice in the Southern
Ocean. A blended product is under development to merge estimates of ship-based thickness with
areal extent of sea-ice conditions as represented by the NIC polygons.


 Previous Page
