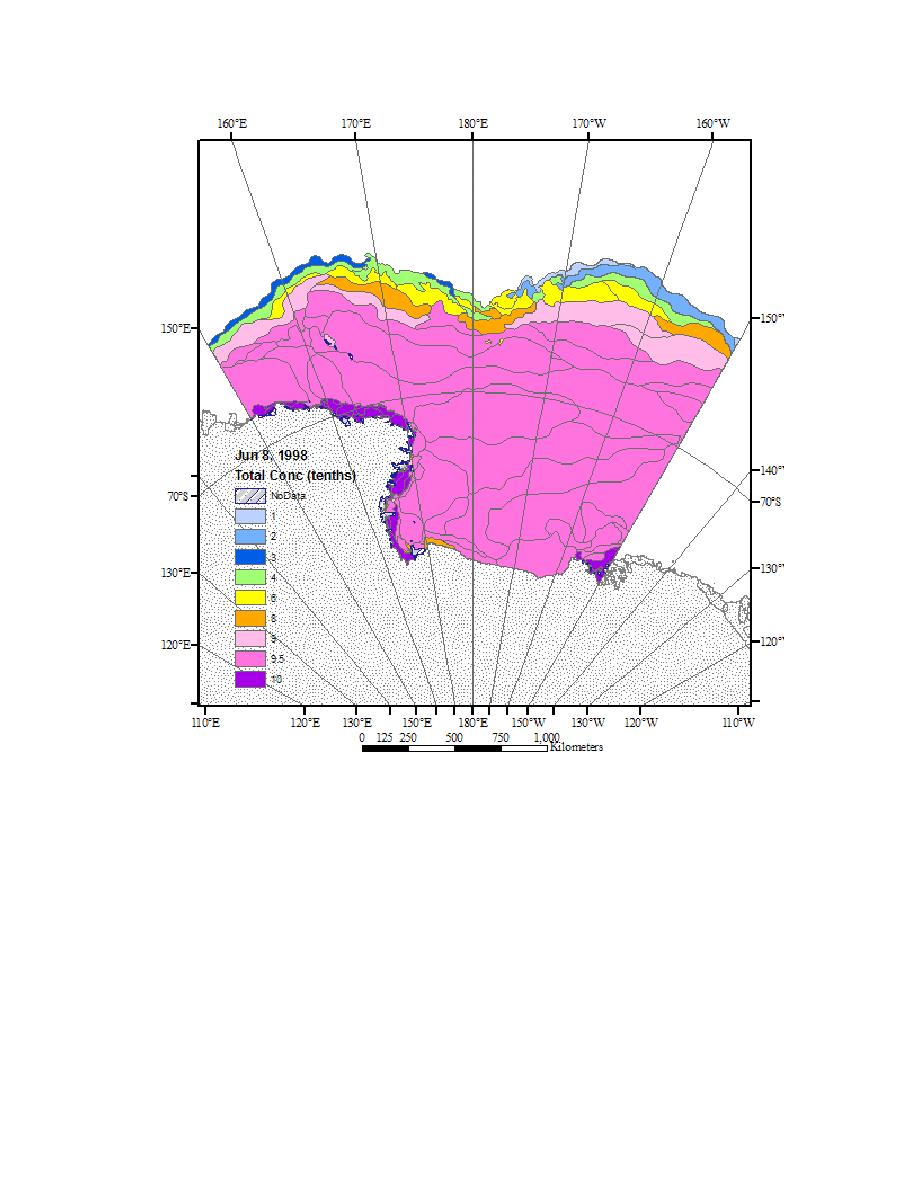
Figure 3. Weekly NIC ice chart spatially subset over the Ross Sea during the week of
June 8, 1998. Each polygon contains sea-ice information including total ice concentration
and stage of development.
The NIC, a joint organization sponsored by the U.S. Navy, the National Oceanic and
Atmospheric Administration (NOAA), and the U.S. Coast Guard, has produced weekly ice charts
for the Southern Ocean since the early 1970's. These sea-ice charts are produced by trained sea-
ice analysts, who discern sea-ice concentration and stage of development information using
aircraft reconnaissance, visible and infrared Advanced Very High Resolution Radiometer
(AVHRR) and Operational Line Scanner (OLS) imagery, passive microwave including
Electrically Scanning Microwave Radiometer (ESMR), SMMR, and SSM/I data, active
microwave Synthetic Aperature Radar (SAR) data, and freezing degree-day models (NIC et al.
1996, Schellenberg et al. 2002). Charts of sea ice in Digital Form (SIGRID) are available from
1973 to 1994 on CD-ROM from 1995 to October 1997 on paper charts, and GIS form starting in
October 1997 (Dedrick et al. 2001). The NIC charts are produced weekly, reporting average ice


 Previous Page
