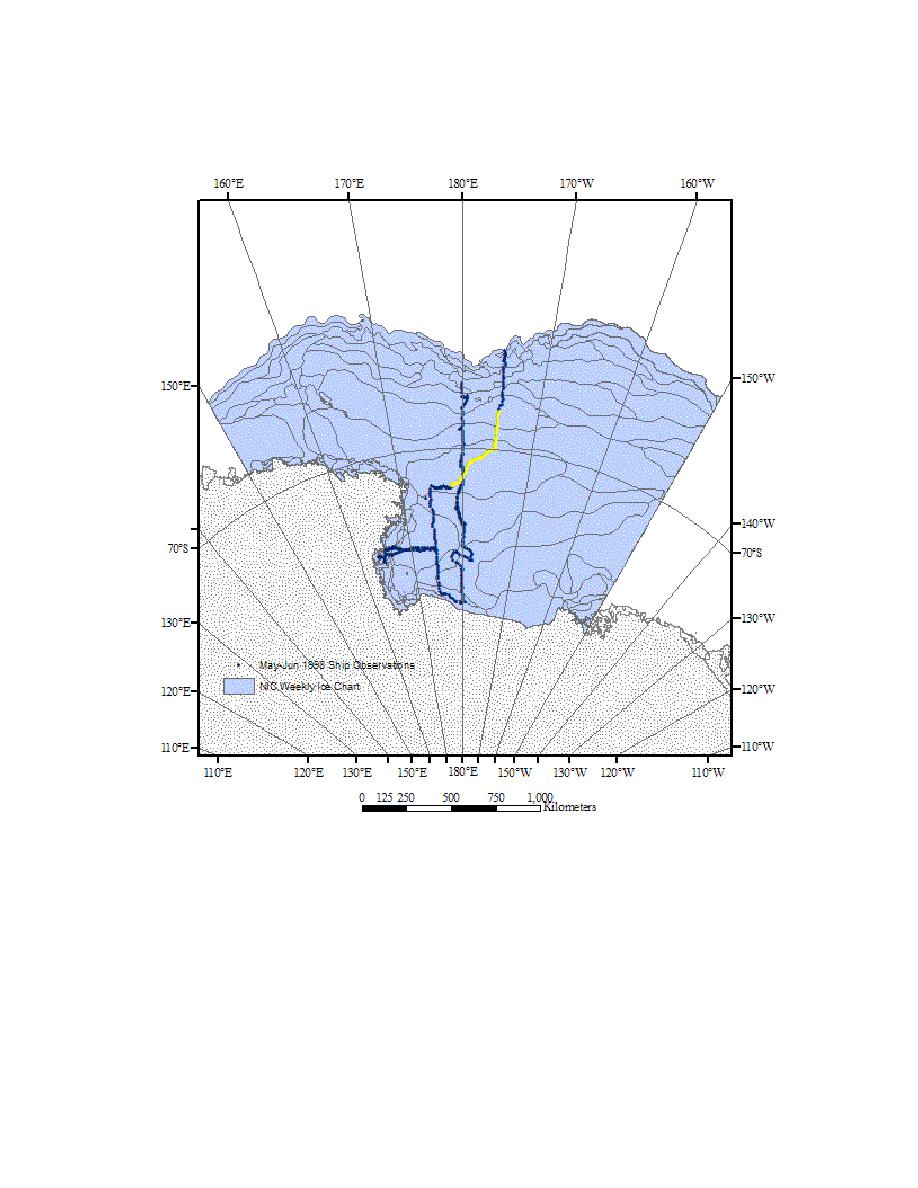
joining (Figure 4 and 5) the coincident hourly ship observations with the NIC weekly ice chart
using ArcMap's spatial join tool..
Figure 4. Ship based observations (point data) during a May/June 1998 voyage overlayed
on a weekly NIC ice chart (polygons data). Yellow dots represent coincident ship
observations with the ice chart during the week of June 8, 1998.
This procedure resulted in a joined table of spatially coincident points overlayed on the weekly
NIC polygons. The ship observation points are then averaged within each NIC polygon to obtain
an average ship thickness within each respective polygon using the dissolve tool to aggregate the
point observations. An accompanying uncertainty is also computed. The NIC thickness and ship
thickness estimates are evaluated using graphical as well as statistical measures (mean absolute
error-MAE, root mean squared error-RMSE and R2).


 Previous Page
